Download
1 / 27
270 likes | 410 Vues
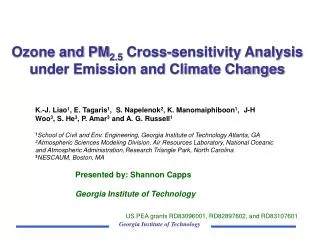
Ozone and PM 2.5 Cross-sensitivity Analysis under Emission and Climate Changes. K.-J. Liao 1 , E. Tagaris 1 , S. Napelenok 2 , K. Manomaiphiboon 1 , J-H Woo 3 , S. He 3 , P. Amar 3 and A. G. Russell 1 1 School of Civil and Env. Engineering, Georgia Institute of Technology Atlanta, GA

E N D
Ozone and PM2.5 Cross-sensitivity Analysis under Emission and Climate Changes K.-J. Liao1, E. Tagaris1, S. Napelenok2, K. Manomaiphiboon1, J-H Woo3, S. He3, P. Amar3 and A. G. Russell11School of Civil and Env. Engineering, Georgia Institute of Technology Atlanta, GA 2Atmospheric Sciences Modeling Division, Air Resources Laboratory, National Oceanic and Atmospheric Administration,Research Triangle Park, North Carolina 3NESCAUM, Boston, MA Presented by: Shannon Capps Georgia Institute of Technology US PEA grants RD83096001, RD82897602, and RD83107601 Georgia Institute of Technology
http://www.grcblog.com http://www.theage.com.au http://www.wildlandfire.com http://www.capcoa.org/images/body.jpg Effects of Climate Change • Increase in the number and intensity of cyclones • Change in wildfire activities • Increased sea levels • Decreased bio-diversity • And …. Impacts on regional air quality and human health Georgia Institute of Technology
Previous Studies • Changes in future climate are predicted to negatively impact O3 air quality (Hogrefe, et al., 2004; Leung and Gustafson, 2005; Mickley, et al., 2004; Murazaki and Hess, 2006, etc.). • 4.2 ppb increases in summertime ozone concentrations in 2050s based on the IPCC A2 scenario (Hogrefe, et al., 2004). • 12 additional days in the northeastern U.S. each year ozone will exceed 0.08 ppm in the decade 2090s compared with 1990s based on the IPCC A1 scenario (Murazaki and Hess, 2006). Georgia Institute of Technology
Important Air Pollutants • Ozone (O3)- precursors: NOx, VOCs, etc. • Nitrogen dioxide (NO2) • Sulfur dioxide (SO2) • Particulate matter (PM) – PM2.5(particulate matter with an aerodynamic diameter less than 2.5 micrometers)-precursors: SO2, NOx, NH3, VOCs, etc. • Carbon monoxide (CO) • Lead Pollutants of interest Georgia Institute of Technology
Secondary formation of ozone and PM2.5 Interrelated Origins of Ozone and PM2.5 Cohan et al., Env. Management, 2007 (Meng et al., Science, 1997; Lamarque et al.,GRL, 2005; Unger, PNAS, 2006) Georgia Institute of Technology
Air Quality Modeling Procedure Leung and Gustafson (2005) NASA GISS IPCC A1B MM5 Meteorology MCIP 2001 climate 2050 climate SMOKE(w/ 2001 EI) SMOKE(w/ 2050 EI) Emissions Air quality model CMAQ-DDM Georgia Institute of Technology *Leung and Gustafson (2005), Geophys. Res. Lett., 32, L16711
21st-Century Climate(IPCC, 2007) Georgia Institute of Technology
Global and Regional Climate Models* Georgia Institute of Technology * Mickley, et al, 2004; Leung and Gustafson (2005)
RPO 2018 Activity data (On-road mobile) Use EPA 2020 CAIR-case inventory Update cross-references SMOKE/M6-ready activity data for 2050 Emission Inventory Projection Woo, et al., J. AW&A, 2008 Georgia Institute of Technology
Future Emission Changes - US SO2 emissions NOx emissions NH3 emissions PM2.5 emissions 2001 2020 2050 Woo et. al, 2008 Georgia Institute of Technology
C o + Co ∆C p Cp + E Ep Eo E Sensitivity Metric Si,j : sensitivity Ci : concentration of pollutant i Ej : emission of precursor j First-order Sensitivity - Using (Decoupled Direct Method) DDM Yang et. al, 1997, Dunker et. al, 1994 Georgia Institute of Technology
Atlantacity center Five Cities in the Continental US Five cities - Nonattainment areas for MDA8hr O3 and 24-hr PM2.5 levels MDA8hr O3 – city center and regional maximum PM2.5 – city center Georgia Institute of Technology
Daily Max. 8-hr Ozone Concentration and Sensitivity - Atlanta City center Sensitivities of MDA8h O3 to anthropogenic NOx (Y-axis) versus MDA8h O3 concentrations (X-axis) Regional max. Georgia Institute of Technology
Sensitivities of Daily Max. 8-hr O3 and 24-hr PM2.5 to Anthropogenic NOx Emissions - Atlanta City center (1% changes in emissions) Y-axis: Sensitivities of 24-hr PM2.5 to anthropogenic NOx emissionsX-axis: Sensitivity of daily max. 8-hr ozone to anthropogenic NOx emissions Liao, et al., 2008 Georgia Institute of Technology
Number of Days with Positive and Negative Sensitivities of Daily Max. 8-hr O3 to NOx Emissions Note: The first seven days of each year are excluded to minimize the impacts of initial concentrations, leaving 359 days for analysis Liao et. al, 2008 Georgia Institute of Technology
Sensitivities of Sulfate and Nitrate to Ammonia Emissions- Atlanta City center (1% changes in emissions) Y-axis: Sensitivity of sulfate to ammoniaX-axis: Sensitivity of nitrate to ammonia Liao, et al., 2008 Georgia Institute of Technology
Conclusions • Controls of NOx emissions reduce PM2.5 but may increase daily maximum ozone levels for cities examined. • Planned controls on anthropogenic NOx emissions lead to more positive responses to urban ozone reductions in the future. • Overall, the sensitivities of (NH4)2SO4 to NH3 increase, a finding that is opposite of the one for NH4NO3. • Complexities in policy-making due to trade-offs between reductions in daily maximum 8-hr ozone and daily-average PM2.5 are predicted to decrease. Georgia Institute of Technology
Daily Max. 8-hr Ozone Concentration and Sensitivity - LA City center Regional max. Sensitivities of MDA8h O3 to anthropogenic NOx (Y-axis) versus MDA8h O3 concentrations (X-axis) Georgia Institute of Technology
Sensitivities of Daily Max. 8-hr O3 and 24-hr PM2.5 to Anthropogenic NOx Emissions - LA City center (1% changes in emissions) Y-axis: Sensitivities of 24-hr PM2.5 to anthropogenic NOx emissionsX-axis: Sensitivity of daily max. 8-hr ozone to anthropogenic NOx emissions Liao, et al., 2008 Georgia Institute of Technology
Daily Max. 8-hr Ozone Concentration and Sensitivity - Chicago City center Regional max. Sensitivities of MDA8h O3 to anthropogenic NOx (Y-axis) versus MDA8h O3 concentrations (X-axis) Georgia Institute of Technology
Daily Max. 8-hr Ozone Concentration and Sensitivity - Houston City center Regional max. Sensitivities of MDA8h O3 to anthropogenic NOx (Y-axis) versus MDA8h O3 concentrations (X-axis) Georgia Institute of Technology
Daily Max. 8-hr Ozone Concentration and Sensitivity – New York City center Regional max. Sensitivities of MDA8h O3 to anthropogenic NOx (Y-axis) versus MDA8h O3 concentrations (X-axis) Georgia Institute of Technology
Sensitivities of Daily Max. 8-hr O3 and 24-hr PM2.5 to Anthropogenic NOx Emissions - Chicago City center (1% changes in emissions) Y-axis: Sensitivities of 24-hr PM2.5 to anthropogenic NOx emissionsX-axis: Sensitivity of daily max. 8-hr ozone to anthropogenic NOx emissions Liao, et al., 2008 Georgia Institute of Technology
Sensitivities of Daily Max. 8-hr O3 and 24-hr PM2.5 to Anthropogenic NOx Emissions - Houston City center (1% changes in emissions) Y-axis: Sensitivities of 24-hr PM2.5 to anthropogenic NOx emissionsX-axis: Sensitivity of daily max. 8-hr ozone to anthropogenic NOx emissions Liao, et al., 2008 Georgia Institute of Technology
Sensitivities of Daily Max. 8-hr O3 and 24-hr PM2.5 to Anthropogenic NOx Emissions -NY City center (1% changes in emissions) Y-axis: Sensitivities of 24-hr PM2.5 to anthropogenic NOx emissionsX-axis: Sensitivity of daily max. 8-hr ozone to anthropogenic NOx emissions Liao, et al., 2008 Georgia Institute of Technology
Sensitivities of Sulfate and Nitrate to Ammonia Emissions- Chicago, Houston. LA and New York Liao, et al., 2008 Georgia Institute of Technology