Download
1 / 20
200 likes | 342 Vues
This paper discusses a prototype system developed for forest fire monitoring in Thailand, leveraging Earth observation data for enhanced agricultural and fire management. The objective is to promote the interoperability of data between Japan's Ministry of Agriculture, Forestry, and Fisheries and the National Space Development Agency. The system employs web mapping technology to facilitate data access and usage for operators. Key features include fire risk maps, JERS1-SAR mosaic data, and hotspot information, enabling timely evaluations and efficient responses to forest fire threats.

E N D
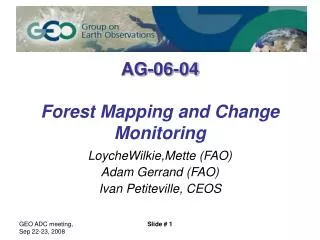
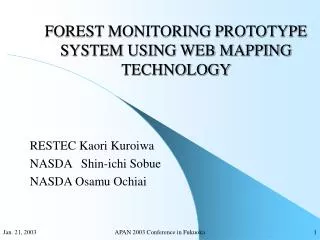
FOREST MONITORING PROTOTYPE SYSTEM USING WEB MAPPING TECHNOLOGY RESTEC Kaori Kuroiwa NASDAShin-ichi Sobue NASDA Osamu Ochiai APAN 2003 Conference in Fukuoka
Contents • Background • Purpose • Introduction of Web Mapping Technology • Providing Data • Use case • System Overview • Main Considerations for system design • Conclusion APAN 2003 Conference in Fukuoka
Background • Earth observation data has been highly effective in environmental monitoring, especially it has been shown to be useful for monitoring forest fires and for agricultural management • However, Earth Observation Satellite data is not yet commonly used for operational purposes. • So, we would like to promote research and operational use of Earth Observation Satellite data for agriculture and forest fire applications by providing multi-satellite data and in-situ data. APAN 2003 Conference in Fukuoka
Purpose • To study new services and possibilities of data interoperability between the Ministry of Agriculture, Forestry and Fisheries of Japan (MAFF) and National Space Development Agency of Japan (NASDA)through the Development of a prototype system for the forest fire monitoring in Thailand APAN 2003 Conference in Fukuoka
Introduction of web mapping technology • Standard interface of Interoperability for Spatial data via WWW. • OpenGISConsortium (OGC) Specification • Standard interface between Client and Server • Possible to send the request as same message format to multiple servers (to the distributed environment) • Possible to develop own system independently • Don’t need to understand the system configuration of other servers, only care about the standard interface APAN 2003 Conference in Fukuoka
WMS (Web Map Server) http://a-map-co.com/mapserver.cgi?VERSION=1.1.0&REQUEST=GetMap& SRS=EPSG:4326&BBOX=-97.105,24.913,78.794,36.358& WIDTH=560&HEIGHT=350&LAYERS=AVHRR-09-27&STYLES=& FORMAT=image/png&BGCOLOR=0xFFFFFF&TRANSPARENT=TRUE& EXCEPTIONS=application/vnd.ogc.se_inimage Combined Image Reference:http://www.opengis.org/techno/implementation.htm http://b-maps.com/map.cgi?VERSION=1.1.0&REQUEST=GetMap& SRS=EPSG:4326&BBOX=-97.105,24.913,78.794,36.358& WIDTH=560&HEIGHT=350&LAYERS=BUILTUPA_1M,COASTL_1M,POLBNDL_1M& STYLES=0XFF8080,0X101040,BLACK&FORMAT=image/png&BGCOLOR=0xFFFFFF& TRANSPARENT=TRUE&EXCEPTIONS=application/vnd.ogc.se_inimage APAN 2003 Conference in Fukuoka
Providing Data • Fire risk map • the risk of each 10 days is determined by the dryness of the area using NOAA/AVHRR NDVI and channel 4. • JERS1-SAR mosaic data • Mosaic data of Southeast Asia using JERS1-SAR • NoForest Area mask data • No Forest Area mask data of Thailand • Hotspots data • Hotspots extract from NOAA/AVHRR data • Hotspots extract from DMSP/OLS data • Map data • DCW (Digital Chart World): coastline, boundaries • Global Map: river, load and so on APAN 2003 Conference in Fukuoka
Fire risk maps October March with no forest area mask October with no forest area mask March APAN 2003 Conference in Fukuoka
JERS1-SAR image Target area: Thailand APAN 2003 Conference in Fukuoka
Use case • Target user • Forest fire monitoring operators in Thailand • Needs of operators • To grasp the situation about extensive forest fire easily and timely • For an operational system it is important to study the use case. APAN 2003 Conference in Fukuoka
Use Case • Operators can find the latest fire locations and evaluate further risk of fires by combining fire risk maps with the latest hot spot information. • For a more detailed understanding the operator can zoom into an area and overlay hot spots onto the JERS-SAR mosaic image to understand the topography. Also, the operator can overlay state boundaries, rivers, roads, etc. • For confirming the location of fire spot the operator can see the lat/lon information on other window. • Operator can do temporal searches on historical (past) Fire Risk maps and hot spots database. • Operator can save the image in JPEG format and hot spot lat/lon information in text format. APAN 2003 Conference in Fukuoka
System overview • Fire risk map server (WMS 1.1.0) • For getting a request from the forest monitoring client and sending to the client a fire risk map which is processed according to a request • JERS1-SAR mosaic data server (WMS 1.1.0) • For getting a request from forest monitoring client and sending to the client a mosaic image which is processed according to a request • Hotspots server (WMS 1.1.0 & WFS 0.0.14) • For overlying the hotspots on the fire risk map and mosaic image, WMS interface is used. • For showing the location (lat/lon) of hotspots WFS interface is used. • Forest monitoring client • For sending the requests to multiple server and getting the image from multiple servers and combine multiple images APAN 2003 Conference in Fukuoka
Machine environment APAN 2003 Conference in Fukuoka
Figure 2 System Configuration JERS-SAR mosaic data server (WMS) Hotspots data server (WMS&WFS) AVHRR&DMSP hotspotsDB Fire risk map Request Forest Monitoring Client internet Result internet User WMS and WFS I/F pert Request Request Request Request Image Image Image GML Fire risk map (WMS) JERS SAR Mosaic data server APAN 2003 Conference in Fukuoka
Main considerations for system design • Simple and Easy user interface • According to study the use case, the usefulness functions were selected. • Reduce a missing of input form user by preparing the check box and pull down menu • Consideration of limited bandwidths in Thailand • Small data sizes • Minimize the number of transmissions • How to show the continuous days of forest fire • Important to know the continuous days of forest fire • Forest fire usually continue 3days, big forest fire continue 5days. • Scientists wanted the system to show the number of days that a fire had burned in the same area. • The solution chosen was to show the age of the fire by its color. Thus, a new fire is shown in red, a fire one day old is shown in pink, and fires that are two or more days old are shown in another color. APAN 2003 Conference in Fukuoka
Display image APAN 2003 Conference in Fukuoka
1day ago 1day ago 2day ago 2day ago 3day ago 3day ago 0 0 Legend of Hot spots AVHRR hotspots DMSP/OLS hotspots APAN 2003 Conference in Fukuoka
Conclusions • Confirmed the possibilities to provide the valuable services by combining the data from multiple servers using web mapping technology • By using the standard interface • Possible to provide the data to WMS compliant system • Increase the field of data usage • Prototype system operation is scheduled to end of February, 2003. • We will obtain comments from the users to guide us in developing a more useful system. • In addition, this data will be available to the planned Digital Asia Network for Southeast Asia as a demonstration system. APAN 2003 Conference in Fukuoka