Time series forecasting
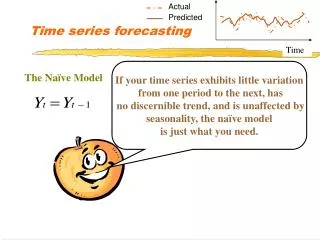
Time series forecasting. Actual. Predicted. Time. If your time series exhibits little variation from one period to the next, has no discernible trend, and is unaffected by seasonality, the naïve model is just what you need. The Naïve Model. The mean forecast model.

Time series forecasting
E N D
Presentation Transcript
Time series forecasting Actual Predicted Time If your time series exhibits little variation from one period to the next, has no discernible trend, and is unaffected by seasonality, the naïve model is just what you need. The Naïve Model
The mean forecast model • Here we just compute the mean of the time series up to the last observation to forecast the variable for the next period. That is: Don’t use this methodif your series has an upward or downwardtrend
Moving average models These models work well for a fairly stable time series without a significant trend or seasonal component. The model is summarized as follows: Yt + 1 = (Yt + Yt - 1 + Yt - 2 + Yt - n)/n Thus, if n = 4, we have a four period moving average.
Weighted Moving Average Model Let: Yt + 1 = (w1Yt + w2Yt - 1 + w3Yt - 2 + . . . + wnYt - n) where wi is the weight attached to the ith observation and there are n periods weighted. The trick is to select the valueof n and corresponding values of wi so as to minimize MSE or MAD
Example: Forecasting retail sales in the South The Data: Monthly data on retail sales in the Southern U.S. beginning in January 1970 and ending in August 2000 (367 observations) or T= 367 • Methods: • The naïve model • 12-month moving average • 3-month weighted average (the weights are .5 (t-1), .25 (t-2), and .25 (for t-1). • The mean forecast model