Understanding Multiple Regression and Dummy Variables for Statistical Analysis
110 likes | 228 Vues
Learn how to predict values using regression equations and interpret the influence of dummy variables in statistical analysis. Explore examples and coding methods for regression models.

Understanding Multiple Regression and Dummy Variables for Statistical Analysis
E N D
Presentation Transcript
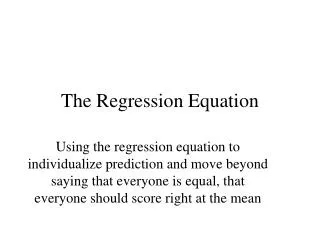
The Regression Equation • A predicted value on the DV in the bi-variate case is found with the following formula: Ŷ = a + B (X1)
For Multiple Regression Ŷ = a + B1(X1) + B2 (X2) + B3 (X3)
Example: • Income (Y) regressed on R’s education (IV1) and Father’s education (IV2). • Constant (a) = 15,000 • B1 (education) = 125 • B2 (fathers educ) =25 Predict a value for Y when respondents educ = 14 years & fathers educ = 12 years.
Answer Ŷ= a + B1(14) + B2 (12) B1 = Respondent’s Educ B2 = Father’s Educ Ŷ= 15,000 + 125 (14) + 25 (12) Ŷ = 15,000 + 1,750 + 300 Ŷ = 17,050
Dummy Variables • Remember that multiple regression is used when: • variables are interval/ratio • Dummy variables allows us to use nominal data. • Most often we are comparing groups of individuals (i.e., men & women; Blacks & Whites; Republicans & Democrats)
A dummy variable is: • A variable coded 1 to indicate the presence of an attribute and coded 0 to indicate its absence. • Dummy variables are used with nominal data like gender, religion and race. • Dummy Variables allow us to assess how the relationships theorized in the multiple regression model hold for different groups (e.g., men and women).
Coding dummy variables • For our purposes we will have only 2 categories • Categories will be coded 0 & 1 • Example (females =0; males =1) • The category coded 0 is considered the “left out” category (group). • The category coded 1 is the comparison group In other words: • You are comparing the group coded 1 with the group coded 0.
EXAMPLE Sex • If you code females = 0 & males =1, • you are comparing men to women. • If you coded males = 0 & females=1, • you are comparing women to men.
Example • We regress income on education and family background (father’s education). • But, how does gender influence this relationship? • Regression with dummy variables answers this question.
Income regressed on R’s educ., fathers educ., and gender (coded 0=females, 1=males): Ŷ = a + B1(X1) + B2 (X2) + B3 (X3) a= 15,000 B1(educ)= 110 B2 (faeduc)= 15 B3 (gender)= 150 Let’s interpret B3: 2 possible values for gender (0 & 1) so 150 (0) = 0 (females) 150 (1) = 150 (males) So males earn $150 more than women.
Let’s plug values into the equation: Predict income for a male respondent with14 years of education and a father who has 12 years of education. Ŷ = 15,000 + 110 (14) + 15 (12) + 150 (1) = 15,000 + 1,540 + 180 + 150 = 16,870 What if the respondent were a female? Ŷ = 15,000 +110 (14) + 15 (12) + 150 (0) = 15,000 + 1,540 + 180 + 0 = 16,720