Download
1 / 1
10 likes | 160 Vues
ANATOMY OF A STEM-AND-LEAF PLOT.

E N D
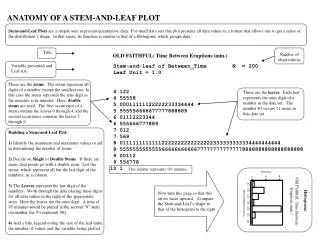
ANATOMY OF A STEM-AND-LEAF PLOT Stem-and-Leaf Plots are a simple way to present quantitative data. For small data sets this plot presents all data values in a format that allows one to get a sense of the distribution’s shape. In that sense, its function is similar to that of a Histogram, which groups data. Title Number of observations OLD FAITHFUL: Time Between Eruptions (min.) Variable presented and Leaf size. Stem-and-leaf of Between_Time N = 200 Leaf Unit = 1.0 4 122 4 55558 5 00011111122222233334444 5 555556666677777888889 6 01112223344 6 555666777889 7 012 7 569 8 01111111111112222222222222222333333333334444444444 8 555555555555566666666666777777777777778888888888888888888 9 00112 9 556778 10 1 These are the stems. The stems represent all digits of a number except the smallest one. In this case the stems represent the tens digit as the measure is in minutes. Here, double stems are used. The first occurrence of a stem contains the leaves 0 through 4, and the second occurrence contains the leaves 5 through 9. These are the leaves. Each leaf represents the ones digit of a number in the data set. The number 83 occurs 11 times in this data set. Building a Stem-and-Leaf Plot: 1) Identify the minimum and maximum values to aid in determining the number of stems. 2) Decide on Single or Double Stems. If there are many data points go with a double stem. List the stems, which represent all but the last digit of the numbers, in a column. 3) The Leaves represent the last digit of the numbers. Work through the data placing these digits for all data values to the right of the appropriate stem. Here the leaves are the ones digit. A time of 95 minutes would be placed in the second “9” stem (remember the 9’s represent 90). 4) Add a title, legend noting the size of the leaf units, the number of values and the variable being plotted. This number represents 101 minutes. Now turn this page so that this arrow faces upward. Compare the Stem-and-Leaf’s shape to that of the histogram to the right . Old Faithful:Time Between Eruptions (min.) Histogram: