Download
1 / 21
210 likes | 229 Vues
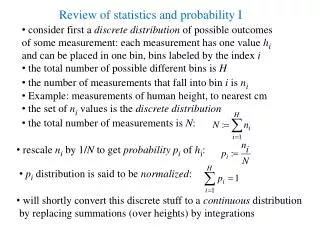
Explore probability concepts, counting principles, permutations, independent events, measures of central tendency, and correlation in statistics. Practice with examples to enhance understanding.

E N D
Probability • P (event)=favorable outcomes • total possible outcomes • P(left handed students in classroom)= # of left handed students = • total # of students in class • Probability is a number between 0 and 1. The closer a probability is to 1 or 100%, the more likely it is an event WILL occur. • p(no school on Sundays)=100% or 1. • Probability of Mutually Exclusive Events: events that cannot both happen at the same time, either A OR B. Find the sum of the probabilities. Example: p(rolling 1 OR 3 on one die)= p(1) + p(3)= = 1/6 + 1/6=2/6=1/3
Jolly Jelly Beans • A bag contains 7 red, 6 green, and 7 orange jelly beans. The probability of selecting a red jelly bean at random is • a) 7_b) 13c) 7_d) 1- 7_ • 20 20 19 20
Jolly Jelly Beans • P(red jelly bean)= # of red jelly beans • total number of jelly beans • = 7 red • 20 total • a) 7__ • 20
FUNDAMENTAL COUNTING PRINCIPLE • To find the number of ways to make successive choices in a series of different categories, MULTIPLY together the number of choices in each category. • Example: How many choices of pizza are available if there are 2 choices of crust, 2 choices of sauce, and 4 choices of toppings? • 2 x 2 x 4 = 16 different pizzas • You may want to draw a tree diagram
SALADS • How many different salads are available on a restaurant buffet if there are : • 3 choices of lettuce- romaine, bibb, and iceberg • 5 choices of vegetables- tomatoes, peppers, carrots, cucumbers, and celery • 3 choices of dressings- Italian, Ranch, and Balsamic • 3 lettuce * 5 vegetables * 3 dressings =
Tree Diagram or Multiplication3 lettuce x 5 vegetables x 3 dressings=45 salad choices • Type of Lettuce Type of Vegetables Type of Dressing • Romaine Tomatoes • Peppers • Carrots • Cucumbers • Celery • Bibb Tomatoes • Peppers • Carrots • Cucumbers • Celery • Iceberg Tomatoes • Peppers • Carrots • Cucumbers • Celery
Permutations • An ordered arrangement of people or objects • Example: • There are 6 students in the back row of class. Find the number of different seating arrangements for those 6 students . • _6___ x __5__x _4___x _3___ x _2____x 1_____ = 6!= • 1st seat 2nd seat 3rd seat 4th seat 5th seat 6th seat
Charm Bracelet Arrangement • How many different ways can I arrange the 10 charms on my bracelet?
Charm Bracelet • 10 x 9 x 8 x 7 x 6 x 5 x 4 x 3 x 2 x 1 = 10! =3,628,800
Independent Events • Two or more events are independent if the outcome of one event does not affect another event. MULTIPLY the probabilities. • Example: • p( flipping heads on dime AND penny)= ½ x ½ = 1/4
Weather Forecast • The local meteorologist predicts a 10% chance of rain AND 50% chance of wind on Sunday. What is the probability of rain AND wind on Sunday?
Weather Forecast • Convert percents to decimals • Multiply probabilities • p(rain) = 10%=0.10 p( wind) =50%= 0.50 • p(rain AND wind)= 0.10 x 0.50=0.05=5%
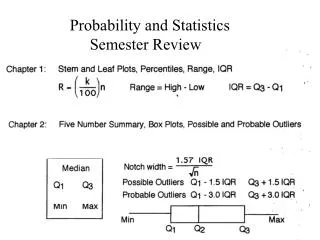
STATISTICS • The study of gathering, organizing, analyzing, representing, and interpreting data. • Measures of Central Tendency • Mean: average; the sum of data set ÷ number in the data set • Median: middle number when arranged in numerical order • Mode: number(s) appearing most often in data set, if any. • Range: interval in which all numbers in data set lie. Max-Min
Practice with Measures of Central Tendency • Nick’s bowling scores for his last 20 games are: • 130, 135, 135, 138, 140, 119,159, 156, 156, 151,141, 141, 145, 145, 145, 145,123, 162,169,128 • Construct a frequency table and histogram of the bowling scores • Find the mean, median, mode, and range.
Using 1-Variable Stats to find Mean, Median, Mode, and Range
Correlation • A scatter plot is a statistical display using ordered pairs of numbers that you can use to see how data in one set is related to data in a second set. Recall the example of the college basketball statistics of minutes per game and points per game. • If you can picture a line (trend line) about which the data clusters and sloping up to the right on a scatter plot, you would say there is a positive correlation between the data sets. The closer the correlation coefficient is to 1 (r=1), the stronger the positive correlation between the data sets. • If you can picture a line (trend line) about which the data clusters and sloping down to the right on a scatter plot, you would say there is a negative correlation, between the data sets. The closer the correlation coefficient is to –1 (r=-1), the stronger the negative correlation between the data sets. • If you cannot picture any reasonable line related to the scatter plot, you would say there is little of no correlation between the data sets. The closer the correlation coefficient is to 0 (r=0), the stronger the no correlation between data sets.
Normal Distribution (Curve) • A set of data has a normal distribution if that distribution is symmetric and bell-shaped. A normal distribution is an important statistical data distribution pattern occurring in many natural phenomena, such as height, blood pressure, and IQ. • Below is a sample of a normal curve with indicated standard deviations. • Rules for data with a bell-shaped distribution: • About 68% of all data fall within ONE standard deviation of the mean. • About 95% of all data fall within TWO standard deviations of the mean. • About 99.7% of all data fall within THREE standard deviations of the mean.
NORMAL CURVE EXAMPLE • The teachers at the Potter and Kenton Career Centers were surveyed on the number of minutes commuting to work each day. The times are normally distributed with a mean of 35 minutes and a standard deviation of 11 minutes. • A. What percentage of teachers had commuting times of less than 13 minutes? • B. What percentage of teachers had commuting times between 24 and 46 minutes?
NORMAL CURVE EXAMPLE • Label the center line MEAN= • Label each of the standard deviations