Lecture 7 Cost Minimization and Profit Maximization
180 likes | 492 Vues
Lecture 7 Cost Minimization and Profit Maximization . Isocost curve. Isocost Curve shows various combinations of inputs that a firm can buy with the same level of expenditure/Cost P L L + P K K = C where C is the total cost of production P L = Price of labor P K = Price of capital

Lecture 7 Cost Minimization and Profit Maximization
E N D
Presentation Transcript
Isocost curve • Isocost Curve shows various combinations of inputs that a firm can buy with the same level of expenditure/Cost PL L + PK K = C where C is the total cost of production PL = Price of labor PK = Price of capital Slope of the isocost curve is the price ratio of inputs which is PK /PL
Capital C/PK Slope = -PK /PL 0 Labor C/PL
All the isocost curves to the right of a given isocost curve show higher level of total cost. • All the isocost curves to the left of a given isocost curve show lower level of total cost.
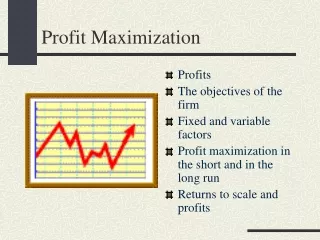
Optimal Decision of Firm • The main objective of firm is to maximize profit. • Profit is the gap or difference between revenue and cost. That is Profit= Revenue ( R) - Cost (C) First lets find out how we can find the revenue of a firm. If the output/production of firm is expressed as Q and price of per unit of the output is expressed as P then revenue will be R= PQ That is revenue is price times quantity. We already know that production function can be written as Q = f (K,L) where we assume that capital and labor are the two inputs. So we can write R= P f(K,L) If total cost is C= PL L + PK K Then the profit becomes Profit= P f(K,L)- (PL L + PK L)
There are two ways the firm can take the optimal decision about the profit maximization. • First Method ( Minimizing Cost): We know thatProfit= Revenue ( R) - Cost (C). Suppose the firm decided to produce a certain amount of output, for example 100 units. So we can draw an isoquant that shows 100 units of output. Now if the per unit price of the output is P then the total revenue is R=P*Q= P*100. Here the total revenue from 100 units of output is fixed because the price of the output is fixed. Now we know that the total cost C= PL L + PK K . We can draw different isocost lines showing different costs. Lets draw three isocost lines showing different costs of 50, 100 and 150. As the total revenue is fixed so the firm can maximize profit by minimizing the cost that means choosing the lowest cost. From the following graph we can see that the isoquant ( Q=100) cuts the three isocost lines marked by 50, 100, 150 in three points A, B and C respectively. We can observe that point A and B cannot be a profit maximizing point because cost is higher compared to point C. In all three points A, B and C total revenue is the same (TR=P*Q= P*100) but at point C cost is minimum ( cost is 50 at point C). So profit is maximized at point C where the combination of labor and capital is ( L1, K1) We can conclude that profit maximizing point will be found at the tangency point of isoquant curve and isocost line. As at point C, isoquant curve and isocost line are tangent that’s why point C is the profit maximizing point.
Same as the tangency condition of utility maximization, we have a tangency condition of profit maximization. • Tangency Condition of Profit Maximization: Tangency condition of profit maximization says that the isoquant curve will tangent to isocost line at the profit maximizing point. That means the slope of isoquant will be equal to slope of isocost line. We know that slope of isoquant is MRTSand Slope of isocost line is PK /PL ( Price ratio of inputs, capital and labor) So the tangency condition is MRTS = PK /PL
Second Method: (Maximizing Output and Total Revenue given a Total Cost): In this case we assume that the firm can incur a maximum cost ( because firm has a limited budget) like C=100. That means firms cannot spend more than 100. So to maximize profit firms will want to make the total revenue (TR=P*Q) as large as possible given the cost of 100. As the price is fixed, so the firm can increase revenue by increasing the output. • So first we draw a isocost line showing a cost of 100. Now we draw three different isoquant curves that show different level of output like Q=100, Q=200 and Q=300. • Now comparing point A and B we can see that point A cannot be a profit maximizing point because in both A and B cost is same but at point B, total revenue is higher ( At point B, TR=P*200 and At point A, TR=P*100). The point C in isoquant Q=300 is not feasible because it is outside the isocost line. So Point B is the profit maximizing point where isoquant is tangent to isocost line.
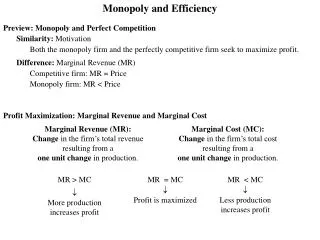
Marginal cost (MC): Marginal cost is the increment, or addition, to cost that results from producing one more unit of output
Marginal Revenue (MR) :Marginal revenue is the increment, or addition, to revenue that results from producing one more unit of output
MR > MC • If marginal revenue exceeds marginal cost, the production of an additional unit of output adds more to revenue than to costs. • In this case, a firm is expected to increase its level of production to increase its profits.
MR < MC • If marginal cost exceeds marginal revenue, the production of the last unit of output costs more than the additional revenue generated by the sale of this unit. • In this case, firms can increase their profits by producing less.
MR = MC(Golden Rule of Profit maximization) • A profit-maximizing firm will produce more output when MR > MC and less output when MR < MC. • If MR = MC, however, the firm has no incentive to produce either more or less output. • The firm's profits are maximized at the level of output at which MR = MC. This is know as golden rule of profit maximization.