Download
1 / 16
171 likes | 432 Vues
Lecture 8 Profit Maximization . Comparison of consumer theory with producer theory . In consumer theory we learned that the main objective of consumer is utility maximization and in producer theory the main objective of producer is profit maximization.

E N D
Comparison of consumer theory with producer theory • In consumer theory we learned that the main objective of consumer is utility maximization and in producer theory the main objective of producer is profit maximization. • In Consumer Theory, the indifference curve shows combinations of goods giving the same utility. • In Production Theory, there is a similar concept known as isoquant curve which shows the combinations of inputs that give the same amount of production
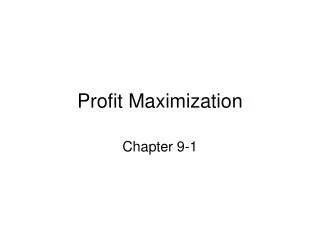
Isoquant • Definition: It is a curve that shows all possible combinations of inputs that can produce the same level of output. • All the isoquants to the right of a given isoquant show higher level of production. • All the isoquants to the left of a given isoquant show lower level of production.
Capital K2 300 K1 200 100 0 Labor L2 L1
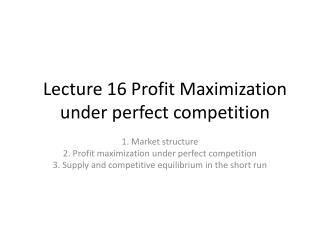
Isocost Line • Isocost line shows various combinations of inputs that a firm can buy with the same level of expenditure/Cost PL L + PK K = C where C is the total cost of production PL = Price of labor PK = Price of capital L = number of worker k= amount of capital
Capital C/PK 0 Labor C/PL
Shift of Isocost line • All the isocost lines to the right of a given isocost line show higher level of total cost. • All the isocost lines to the left of a given isocost line show lower level of total cost.
Tangency Condition of Profit Maximization • Same as the tangency condition of utility maximization, we have a tangency condition of profit maximization. • Tangency Condition of Profit Maximization: Tangency condition of profit maximization says that when the isoquant curve will be tangent ( that means just touching not cutting) to the isocostline then profit is maximized.
Optimal Decision of Firm • The main objective of firm is to maximize profit. • Profit is the gap or difference between revenue and cost. That is Profit= Revenue ( R) - Cost (C) So the firm’s objective is to make this gap as large as possible which will ensure profit maximization. First lets find out how we can find the revenue of a firm. If the output/production of firm is expressed as Q and price of per unit of the output is expressed as P then revenue will be R= PQ That is revenue is price times quantity. We already know that production function can be written as Q = f (K,L) where we assume that capital and labor are the two inputs. So we can write R= P f(K,L) If total cost is C= w. L + r.K ( Where w is the wage and r is the interest rate) Then the profit becomes Profit= P f(K,L)- (w. L + r.K) Here P , w and r are constant. So firm can only choose the amount of L and K. The firm will choose labor and capital in such a way that the gap between total revenue and total cost is as large as possible that means profit is maximized.
Marginal cost (MC): Marginal cost is the increment, or addition, to cost that results from producing one more unit of output • Marginal Revenue (MR) : Marginal revenue is the increment, or addition, to revenue that results from producing one more unit of output
‘Profit Maximization’Optimal Decision at the margin When a producer is maximizing profit, there is no incentive for him to deviate that means increase or decrease production. This implies that if a certain amount of production leads to profit maximization then the producer will not change the level of production. Producer’s decision about production at margin and its relation with profit maximization: Producer’s decision at margin means that how does a producer take decision about changing production (whether to increase or decrease or keep production same). If we find a situation where the producer does not have any incentive to change production then we call this profit maximizing situation.
There can be three situation Case 1: MR > MC • If marginal revenue exceeds marginal cost, the production of an additional unit of output generate more revenue than cost from that additional unit. That means it will make a profit from the additional output level. • In this case, a firm is expected to increase its level of production to increase its profits. Case 2: MR < MC • If marginal cost exceeds marginal revenue, the production of the last unit of output costs more than the additional revenue generated by that unit. That means it will make a loss from the additional output level. • In this case, firms can increase their profits ( here it means reducing loss) by producing less.
(Golden Rule of Profit maximization) A profit-maximizing firm will produce more output when MR > MC and less output when MR < MC. Case 3: MR = MC • If MR = MC, however, the firm has no incentive to produce either more or less output because it makes neither a loss nor a profit from additional output. So the firm's profit is maximized at the level of output at which MR = MC. This is know as golden rule of profit maximization.
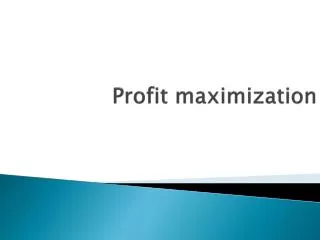
Producer Surplus • The supply curve shows the marginal cost of a firm. Producer surplus is gap/difference between the price and the supply curve ( MC curve). So the area below the price line and above the supply curve is producer surplus • Producer surplus = net gain from trade ( producing and selling of a good or a service) received by producers.
Consumer Surplus and Producer Surplus in Perfect Competition • Gains from trade/ Total surplus= consumer surplus + producer surplus Consumer surplus P Producer surplus Q