Download
1 / 25
250 likes | 383 Vues
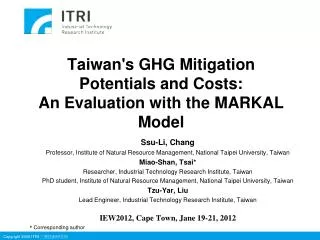
Taiwan's GHG Mitigation Potentials and Costs: An Evaluation with the MARKAL Model. Ssu -Li, Chang Professor, Institute of Natural Resource Management, National Taipei University, Taiwan Miao-Shan, Tsai* Researcher , Industrial Technology Research Institute, Taiwan

E N D
Taiwan's GHG Mitigation Potentials and Costs: An Evaluation with the MARKAL Model Ssu-Li, Chang Professor, Institute of Natural Resource Management, National Taipei University, Taiwan Miao-Shan, Tsai* Researcher, Industrial Technology Research Institute, Taiwan PhD student, Institute of Natural Resource Management, National Taipei University, Taiwan Tzu-Yar, Liu Lead Engineer, Industrial Technology Research Institute, Taiwan IEW2012, Cape Town, Jane 19-21, 2012 * Corresponding author
Outline • Introduction • MARKAL-Taiwan Model • International GHG Reduction Trend • Scenarios and Assumptions • Simulation Results • Discussions • Conclusions
Introduction (1/2) • Taiwan is an island that lacks natural energy resources. It relied on imported energy for 99.30% of its total supply, which comprises 91% fossil fuels and only 0.25% of renewable energy (MOEABOE, 2011). • Taiwan ranked 23rd in the world for countries with the highest CO2 emission countries (IEA, 2011). 145.58 58.52 Source: MOEABOE, 2011.
Introduction (2/2) • Copenhagen Accord asks • The Annex I countries to submit quantitative reduction commitment for 2020 • The non-Annex I countries to submit Nationally Appropriate Mitigation Actions (NAMAs) • Taiwan also announced its NAMAs to international community • CO2 reduction target: 30% lower than REF in 2020 • Objective • Utilize MARKAL model to evaluate emission reduction on Taiwan’s electricity, industrial, buildings, and transportation sectors.
MARKAL-Taiwan Model • The Reference Energy System 256 demand technologies 75 processes technologies 63generation technologies
International GHG Reduction Trend (1/2) • International Low Carbon Society Scenario in 2025 • CO2Target: Lower than REF 0.7%~22%, lower than 2005 level 11%~32% • Energy intensity: 0.13~0.61 toe/US$ • Energy per capital: 1.96~7.6 t CO2/per capita
International GHG Reduction Trend (2/2) • Energy Structure in 2025 • WEO-2011 scenario: coal is the largest energy • AEO-2011, Japan-2009, and Korea-2008 scenarios: oil is the largest energy Source: IEA(2011), USEIA(2011), NIES(2009), Korea(2008).
Scenarios and Assumptions (1/3) • Assumptions in MARKAL model Taiwan Industrial Structure (%) Taiwan Import Energy Price
Scenarios and Assumptions (2/3) • Key Scenario Assumptions
Simulation results(1/8) • CO2 emission pathways in each scenario
Simulation results(2/8) • Energy Supply Structure • The Energy supply growth rate from 2008 to 2025 • REF and GDPL: 1.8%/y~2.4%/y • Four reduction scenarios: 1.3%/y ~1.5%/y • The reduction scenario’s • Total energy supply in 2020 and 2025 are reduced by about 12% relative to REF. • Coal and oil demand proportion more than 87% in REF, thus the proportion of reduction scenario must be reduced to 73% ~ 76%.
Simulation results(3/8) • Power generation structure • Electricity demand growth rate • The REF and GDPL scenarios: 3.7%/y ~5.6%/y till 2025 • Four reduction scenarios decrease to 2%/y ~2.6%/y • Increase electricity consumption ratio through fuel change choices. Nuclear, gas or coal power generation as the base load unit.
Simulation results(4/8) • Sector energy demand in 2025 • Industry: • REF and GDPL scenarios: the oil ratios provided 22.3% • Reduction scenarios: the oil ratios provided30% Industry Sector
Simulation results(5/8) • Buildings: • REF and GDPL scenarios: electricityprovided 71% • Reduction scenarios: Natural gas will replace electricity and oil is due to natural gas target. BuildingsSector
Simulation results(6/8) • Transport: • REF and GDPL scenarios: Traditional fossil oils provided 97% • Reduction scenarios: Traditional fossil oils are replaced under given biomass energy targets in order to reduce the greenhouse gas emissions Transport Sector
Simulation results(7/8) • Total incremental cost in Reduction scenarios • 2015: increases 27% relative to REF • 2020: increase 20%~21% relative to REF • 2025: increase2%~7% relative to REF • the accumulated incremental cost will be 9%~14% relative to REF.
Simulation results(8/8) • CO2 Index in Reduction Scenarios • The per capita emission in 2020 are between 11.1~14.4 tons/per capita, and 9.5 tons/ per capita in 2025. • The emission intensity are between 0.46~0.54 g/US$ in 2020 , and between 0.31~0.33 g/US$ in 2025. • The energy intensity in 2020 are between 0.23~0.28 toe/US$ and 0.22 toe/US$ in 2025.
Discussions (1/2) • The energy demand growth rate • REF and GDPL scenarios : more than 1.8%/y • Reduction scenario: decreases to 1.4%/y, close to the growth rate in WEO-2011. • CO2 reduction ratio • In 2025 a decrease of 56~60% relative to the baseline scenarios, and decrease of 15% relative to 2005 level • This result is higher than Kyoto targets of Annex I countries, and also higher than reported in WEO-2011 and AEO-2011 scenarios. • The total incremental cost • The accumulated incremental cost will be 9%~14% relative to REF.
Discussions (2/2) • Energy intensity • Taiwan’s is higher than in WEO-2011, AEO-2011, and Japan-2009 scenarios • Near Korea-2008 scenario • the Per capita emission • Taiwan’s is also higher than WEO-2011 and AEO-2011 scenarios • Because • 98% of Taiwan’s energy system relies on imports from oversea sources • Limited natural endowments of domestic renewable energy • Limitation of imported natural gas • Nuclear power and oil accounts for high proportions in energy demand structure • Renewable energy only accounts for a small ratio in power generation structure
Conclusions • Taiwan CO2 reduction target is higher than in both WEO scenario and AEO scenario • Taiwantotal accumulated incremental cost increase will be 9%~14% relative to REF • For Taiwan, it is very difficult to reach the reduction target just by relying on mitigation technology. • It is also necessary to allow Taiwan to participate in international flexible mechanisms. • Such participation will also benefit the international community’s GHG reduction efforts tremendously.
Acknowledgements • We would like to thank the Bureau of Energy for financial support in buildingTaiwan MARKAL model. • We thank Yu-FengChou, Jing-Wei Kuo, Kuei-Lan Chou, Ming-Lung Hsu, and Shu-Yi Ho of MARKAL working group in Industrial Technology Research Institute (ITRI) for the research reported here. • We thank Dr. Wei Ming Huang for his valuable suggestions. • Also we thank Jin-Shiuan Li, Ming-Chih Chuang, Chin-Wei Wu, Chi-Liang Tsai , Su-Chen Weng of Bureau of Energy for additional support.
Thank you for your attention ! Miao-Shan, Tsai Researcher Green Energy & Environment Research Laboratories Industrial Technology Research Institute E-mail: marshatsai@itri.org.tw.
Model Background • ITRI established MARKAL-Taiwan model since 1993 supported by ETSAP Outreach Program and Bureau of Energy, Ministry of Economic Affairs. • Major Application • The annual energy outlook • The main analytic results includes: • Energy supply outlook, Energy demand outlook, Power capacity, Electricity Structure, Energy intensity, CO2 intensity, Per capita CO2 emission. • To evaluate the benefits and costs of CO2 mitigation strategies, and make comparison with other nations. • To analyze the impacts of energy conservations and renewable energy development strategies on the future energy structure and GHG emissions of Taiwan.