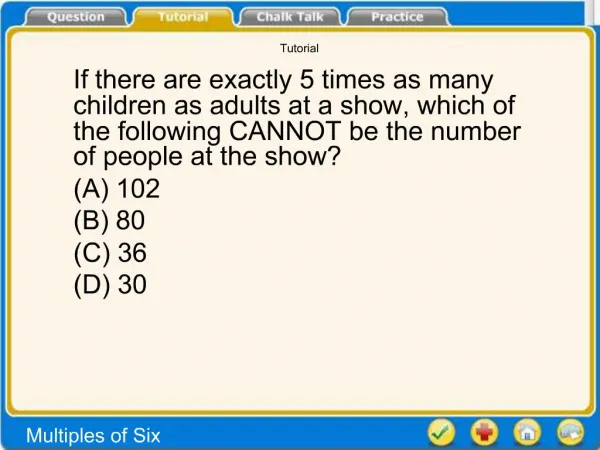
Understanding the Scientific Method: From Hypothesis to Law in Science and Technology
This tutorial explores the foundations of the scientific method, emphasizing the distinction between science and technology. It outlines how scientific theories develop from repeated experiments and the criteria for becoming scientific laws after extensive validation. The tutorial also explains how to analyze data representations such as graphs and tables, and stresses the importance of variables in experimentation. By engaging with practical examples, learners will build a solid understanding of scientific concepts, from hypothesis formation to data analysis and conclusion drawing.

Understanding the Scientific Method: From Hypothesis to Law in Science and Technology
E N D
Presentation Transcript
Tutorial TAKS Science Objective 1 Scientific Method, Safety and Equipment
Science is a body of knowledge. It is knowledge based upon observations and experimentation. Science consists of information that has been formed into theories that become laws after many years of testing and verification. Technology is what science has been used to build. Application of science principles and ideas, made into products and equipment that were not possible without the information learned is called technology. Electronics is the science, computers the technology. Science vs. Technology
Scientific Theory • After observations and repeated experiments are completed, and the data analyzed the results are written into a Theory. • Theories are based upon repeated tests, not just ideas. They must have significant evidence.
Scientific Laws • Once a Scientific Theory has been tested and tried for many years (over 100) and is still found to be true, it becomes a Scientific LAW. • However, if new evidence or information causes it to be changed, it becomes a new Theory again
When answering a question with a table, diagram or graph. . . • Read the title of the graph, table or diagram. • Read each label, and any measurement units for the labels. • Look at the data presented to determine if you see a trend. For example, in a row do the numbers go up or down? or is there no pattern? In a column, do the numbers go up or down? • Carefully look at pictures to determine changes from one diagram to the next.
Once you have gathered the information from the diagram. . . • Now you are ready to find the question in the question. • That means look for a question mark. Use a highlighter! If none, • Look for a question word or blank that needs to be completed.
Let’s try this on a data table . . . • What are we looking at? • We are looking at 4 solutions • if they conduct electricity, • what they do to litmus paper, and • their pH.
Now we know what the table says… • What trends do you see? • What happens to pH and litmus when the electrical conductivity is VERY HIGH? • The pH is 10.0 (litmus blue) or 2.0 (litmus red) • When is electrical conductivity LOW? • The pH is 6.5 (litmus blue) • Only MODERATE when pH is 5.6 (litmus red) • So, what does the pH and litmus tell you about the electrical conductivity? • Strong bases (high pH) and strong acids (low pH) are better at conducting electricity.
Now look at the question. . . 29 The table shows data from an investigation designed to find a liquid solution that is both an acid and a strong electrolyte. Based on the data, a solution that is both an acid and a strong electrolyte is — A Solution 1 B Solution 2 C Solution 3 D Solution 4 What are we looking for? Acid and strong electrolyte, so, low pH and Very High Electrical Conductivity, which we already had identified!!!
Scientific Method • Observe and propose a question. • Make a testable HYPOTHESIS. • Design an experiment • Only one variable is changed • All other conditions must be held constant. • Collect and Analyze data. • Propose a conclusion based upon evidence from the data collected.
Hypothesis • In order to be an hypothesis, it must be a statement that can be tested in an experiment. • Often it is “When this happens, then this will happen” or an “if this, then this” type of statement. • Only one change can occur, and the response to that change must be measurable and/or observable.
55 In an activity, a ball is dropped from a height of 100 cm onto five different materials. The rebound height of each drop is shown in the graph. Which of the following describes the hypothesis most likely being tested? A The mass of the ball affects the rebound height. B The material the ball is made of affects the rebound height. C The height the ball is dropped from affects the rebound height. D The surface the ball is dropped onto affects the rebound height. Read the labels on the graph or data table, they tell you what changed (x-axis) and what was measured (y-axis).
Ask yourself, what was changed for the experimental group? That should be in the first part of the hypothesis. You try! 5 Which of the following is the most likely hypothesis for the experiment described Above? A Vegetation that grows near roadways requires more water than vegetation in other areas. B De-icing solution causes roadways to have more space for vegetation. C Vegetation near roadways changes the effectiveness of de-icing solution. D De-icing solution affects some types of vegetation that grow near roadways.
Variables • Independent: This is what is being changed – Manipulated, Independent on the X-axis – MIX • Dependent: This is what is being measured – Dependent, Responding on the Y-axis – DRY • Controlled – These are those things that could change, but by the design of the experiment are made to stay the same. Examples could be the temperature or amount of liquid, soil or pot type, amount of light or dark.
Data Tables • This is an organized place to record data collected during an experiment. • The first column is the independent (MIX) variable. • The second column should be the dependent variable or what was measured in response
The farther away, the less photosynthesis and bubbles! 3 The picture shows an experiment designed to investigate biochemical activity in a water plant in a dark room. Over time, bubbles can be easily observed and counted as they escape from the funnel. The number of bubbles is an indicator of the rate of photosynthesis. Which of these data tables best reflects the expected results of this experiment?
Analyzing Data • Look for data trends. • That means do the numbers go up or down in the first column, and as they go one direction, is there a pattern in the next column. • Are they doing the same, are they opposite?
Conclusions must be based upon the data collected. Opinions are not to be included, however an inference based upon data and observations may be included to propose another type of experiment. Conclusions also should include an error analysis. What possible changes to the experiment are needed to improve results? Can the experiment be repeated with the same outcome? Conclusions
54 Which conclusion is best supported by the information in the diagram? F Volcanic eruptions were common in the area. G The area was once a marine environment. H Organisms in the area reproduced frequently. J Consumers once outnumbered producers in the area.
1 Which of the following conclusions is supported by these data? A Alertness is directly related to level of distraction. B Shuffling methods can affect alertness. C Alertness levels vary during the day. D Long periods of rest improve alertness.
Reading Tables and Graphs • When a question includes a table or graph, read it first, before the question. Don’t just Look at it READ IT. • What is the Title? • What is being measured or compared? • What units (grams, mLs, minutes, years) are given? • Are the numbers or slope increasing, decreasing? • After reading the data, read the question!
The graph above compares the acidity of apples stored for 270 days under different conditions to the acidity of apples that were just harvested. Some apples were stored at room temperature (20°C), and other apples were stored at 0.5°C. Some of the apples were treated with MCP, an anti-spoilage chemical. According to these data, it can be inferred that — A apples treated with MCP and kept at a low temperature retain acidity best B low temperature prevents any loss of acidity in stored apples C apples stored at room temperature are unaffected by treatment with MCP D high temperature promotes acid production in stored apples
Graphs • Bar – These graphs compare data that it not linear. Comparing number of several species in a biome would be a bar graph. • Pie – This circular graph shows percent of several different parts of the 100%. • Line – Most typically used to show linear and exponential relationships. X-axis would be independent, and Y-axis the measured response.
30 A researcher determined the percentage of electrical energy transformed into different forms of energy by a toaster. The best way to communicate these results is to display the data using a — F histogram G circle graph H line graph J box-whisker graph
Accuracy is the closeness to the true value of a measurement. The smaller the units of measurement, and the maintenance of the equipment increases accuracy. It is possible to be accurate and not precise. Precision is the ability to repeat the same measurement and get the same results. It is possible to be precise and not accurate. The closer the repeat measurements are to each other, the more precise it is. Accuracy vs. Precision
Measurement Tools and Units: What does it measure? Volume in mL Temperature in oC Mass in grams
Your turn! 10. Which of the following pieces of equipment would be most appropriate for measuring the volume of a marble A. B. C. D.
The safest way to dilute concentrated sulfuric acid is to add . A. of water to the acid while stirring B. the acid to water slowly while stirring constantly C. the acid to a small volume of water and then add more water D. dilute sulfuric acid to a small volume of the concentrated acid. 5. The reason for wafting or fanning a small amount of chemical vapors toward the nose as a means to detect odors in a test tube is to A. rid experimental error from excessive loss of mass for reactants or products. B. avoid splashing chemicals into the face of any person. C. protect the respiratory tract against potentially harmful vapors. D. determine the relative strength of the odor before smelling directly. Safety and Equipment