Download
1 / 33
330 likes | 460 Vues
The Typhoon Forecast Operational System (TFOS), a component of the Meteorological Information Comprehensive Analysis and Process System (MICAPS 3.1), is designed to enhance the capabilities of typhoon forecasters in China. Developed using C#.NET and SQL databases, it integrates and analyzes meteorological, satellite, and radar data in real-time. Key functionalities include real-time track display, historical track searches, interactive forecast making, and forecast error statistics. TFOS aims to provide a complete operational platform for effective typhoon tracking and forecasting.

E N D
Typhoon Forecast Operational System(Component of MICAPS3.1 ) China Meteorological Administration May 12, 2009
Outlines: • 1. MICAPS3.1 • 1.1 MICAPS brief introduction • 1.2 MICAPS Framework Features • 1.3 Micaps Main Functions
Outlines: • 2. Typhoon Forecast Operational System • 2.1 Motivation of the component • 2.2 Data Sources • 2.3 Real Track Display • 2.4 History Searches • 2.5 Forecast Error Statistics • 2.6 Interactive Forecast Making • 2.7 Strike Probability
1.1 MICAPS brief introduction • Full name: Meteorological Information Comprehensive Analysis And Process System • Platform: PC-Windows , Linux/Unix • The standard graphics workbench of Chinese forecasters used in almost all local weather centers
1.2 MICAPS 3.1 Framework Features • Open software architecture • The functional Module is optional • Special version for special usage
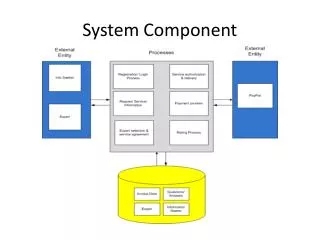
Main framework: Interface Interactive system View Control Graphic layer control Graphic system Images Contours Plots fax TlgP Sat. …. Geographic display …. DataSet/database Algorithms , labels , etc I/O System File DB LOG Vector tools Symbols Projections
1.3 Micaps3.1 Main Functions • An interactive computer system that integrates all meteorological, satellite, and radar data intoone computer workstation. • Allows forecasters the interactive capability to view, analyze, combine, and manipulate graphical and alphanumeric weather data. • Provides effective means for forecasters to prepare and issue forecasts.
Main interface: Title bar Menu Tool bar TyphoonTool box Display area • Layer window Display set window Property window
2. Typhoon Forecast Operational System (TFOS): Typhoon component
2.1 Motivation of the component • The purpose of this component is to adequately make use of the Micaps multiple functions and provide typhoon-forecasters with a complete operational work platform. It can get the real and forecast data from other typhoon forecast centers timely and display it in favorable and convenient ways. • This system is developed in program language C#.NET and use SQL database
2.2 Data Sources • One of this component data source is the real-time TC warning message files from other typhoon forecast centers. The component can update the typhoon track database by searching the usable data from the message files timely. The real track of TC displaying and the forecast making are all based on the database. • The second data source is the history annual track data complied by Shanghai Typhoon Institute and it can be used to search analogical history tracks.
2.3 Real Track Display TFOS includes 5 main functions. The first is real-time track display. The display is on the base of real track database, where the series number and CMA number of every TC is authorized. When the strength of one TC reaches TS, CMA will give it a CMA number. But before then, how to identify one TD?
TCs Identification: • Within 0h~36h, if the distance between a new TC record’s position and any former record’s position less than the corresponding minimum distance, we consider they are the same one TC and they share a same series number. Otherwise, it’s a new TC and gets a new series number. Among 1980~2007 years
Exceptional cases in 28 years: 8225、8226 9004、9005 Time difference: 18~36h Minimum distance: about 200km In these exceptional cases, it needs us to mend it by handwork.
Centers and Methods: • BABJ: Beijing China Subjective • VHHH: Hongkong China Subjective • PGTW: America Subjective • RJTD: Japan Subjective • RKSL: Korea Subjective • TMBJ: Beijing Objective • JTYM: Japan Typhoon Model • JGSM: Japan Other Model • BCGZ: Guangzhou China Subjective • BCSH: Shanghai China Subjective • SHOS: Shanghai China Objective • EGRR: UK Objective
2.4 History Searches The left part controls the date and regions of the wanted history tracks. The above scroll bars set the start-end of years. System uses the track and strength database compiled by Shanghai Typhoon Institute, spanning from 1949 to present. The middle two set the TC’s birth date ranges, so as to identify the seasonal background.
A sample of history analogue searches. In the middle summer, most part of the stronger TCs which go by the way of near the Luzon Island and north of the Taiwan Island pushed forward NNE and affected the Korea Peninsula, though their strength got rather weaker then.
2.5 Forecast Error Statistics Select menu item “Typhoon->FcstErr” to display the forecast errors of different centers and motheds, compared to their own observational values. Click the “Form-statistics” panel or keep the checkbox “AutoOpenRecord” checked to get the detail in numbers.
2.6 Interactive Forecast Making System let you move the mouse to “find” the wanted TC , appoint the current position and select the forecast times. Then use the mouse to modify (drag) the positions of every forecast time. At last, enter the TC forecast issue and release window.
When every thing is ok, you can click the “ok” button to see the encoded text files. “CreateFax” function creates a fax picture file and “SendFax” sends it to CMA database for dissemination.
Probability (70%) Circles: Probability (70%) Circles can also be figured out. When forecast making is well done, you can get the probability circles by changing the value of the item “PlotSetup” in the property window to “True” and the system will popup a property-setting dialog window. Confirm the setting and the circles will appear in the display area.
2.7 Strike Probability Here shows a example of a “strike probability” method in typhoon forecast. The numbers in the pictures are percentages of strike probability to local site. The strike radius is set to 120 km. Please see the detail in relative articles.
This is real time analyses. I wish this TFOS can help our typhoon forecasters to do more.
Thanks for attention! Your comments and advices are welcome!