Graphical Models and Applications
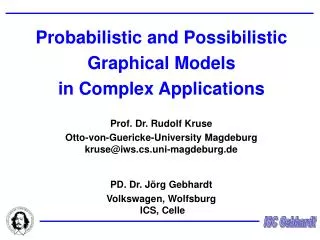
Graphical Models and Applications. CNS/EE148 Instructors: M.Polito, P.Perona, R.McEliece TA: C. Fanti. Example from Medical Diagnostics. Visit to Asia. Smoking. Patient Information. Tuberculosis. Lung Cancer. Bronchitis. Medical Difficulties. Tuberculosis or Cancer. XRay Result.

Graphical Models and Applications
E N D
Presentation Transcript
Graphical Models and Applications CNS/EE148 Instructors: M.Polito, P.Perona, R.McEliece TA: C. Fanti
Example from Medical Diagnostics Visit to Asia Smoking Patient Information Tuberculosis Lung Cancer Bronchitis Medical Difficulties Tuberculosis or Cancer XRay Result Dyspnea Diagnostic Tests
What is a graphical model ? A graphical model is a way of representing probabilistic relationships between random variables. Variables are represented by nodes: Conditional (in)dependencies are represented by (missing) edges: Undirected edges simply give correlations between variables (Markov Random Field or Undirected Graphical model): Directed edges give causality relationships (Bayesian Network or Directed Graphical Model):
“Graphical models are a marriage between probability theory and graph theory. They provide a natural tool for dealing with two problems that occur throughout applied mathematics and engineering – uncertainty and complexity – and in particular they are playing an increasingly important role in the design and analysis of machine learning algorithms. Fundamental to the idea of a graphical model is the notion of modularity – a complex system is built by combining simpler parts.
Probability theory provides the glue whereby the parts are combined, ensuring that the system as a whole is consistent, and providing ways to interface models to data. The graph theoretic side of graphical models provides both an intuitively appealing interface by which humans can model highly-interacting sets of variables as well as a data structure that lends itself naturally to the design of efficient general-purpose algorithms. Many of the classical multivariate probabilistic systemsstudied in fields such as statistics, systems engineering, information theory, pattern recognition and statistical mechanics are special cases of the general graphical model formalism -- examples include mixture models, factor analysis, hidden Markov models, Kalman filters and Ising models.
The graphical model framework provides a way to view all of these systems as instances of a common underlying formalism. This view has many advantages -- in particular, specialized techniques that have been developed in one field can be transferred between research communities and exploited more widely. Moreover, the graphical model formalism provides a naturalframework for the design of new systems.“ --- Michael Jordan, 1998.
We already know many graphical models: (Picture by Zoubin Ghahramani and Sam Roweis)
Plan for the class • Introduction to Graphical Models (Polito) • Basics on graphical models and statistics • Learning from data • Exact inference • Approximate inference • Applications to Vision (Perona) • Applications to Coding Theory (McEliece) • Belief Propagation and Spin Glasses
Plan for the class • Introduction to Graphical Models (Polito) • Basics on graphical models and statistics • Learning from data • Exact inference • Approximate inference • Applications to Vision (Perona) • Applications to Coding Theory (McEliece) • Belief Propagation and Spin Glasses
Basics on graphical models and statistics • Basics of graph theory. • Families of probability distributions associated to directed and undirected graphs. • Markov properties and conditional independence. • Statistical concepts as building blocks for graphical models. • Density estimation, classification and regression.
X1 X2 X3 X4 X6 X5 X7 Basics on graphical models and statisticsGraphs and Families of Probability Distributions There is a family of probability distributions that can be represented with this graph. 1) Every P.D. presenting (at least) the conditional independencies that can be derived from the graph belongs to that family. 2) Every P.D. that can be factorized as p(x1,…,x7)=p(x4|x1,x2) p(x7|x4) p(x5|x4) p(x6|x5,x2) p(x3|x2) belongs to that family.
X X Q m,s X Y X X X Y Q X Basics on graphical models and statisticsBuilding blocks for graphical models p(X)= ??? p(Y|X)= ???? Bayesian approach: every unknown quantity (including parameters) is treated as a random variable. Density estimation Parametric and nonparametric methods Regression Linear, conditional mixture, nonparametric Classification Generative and discriminative approach
Plan for the class • Introduction to Graphical Models (Polito) • Basics on graphical models and statistics • Learning from data • Exact inference • Approximate inference • Applications to Vision (Perona) • Applications to Coding Theory (McEliece) • Belief Propagation and Spin Glasses
Learning from data • Model structure and parameters estimation. • Complete observations and latent variables. • MAP and ML estimation. • The EM algorithm. • Model selection.
Plan for the class • Introduction to Graphical Models (Polito) • Basics on graphical models and statistics • Learning from data • Exact inference • Approximate inference • Applications to Vision (Perona) • Applications to Coding Theory (McEliece) • Belief Propagation and Spin Glasses
Exact inference • The junction tree and related algorithms. • Belief propagation and belief revision. • The generalized distributive law. • Hidden Markov Models and Kalmann Filtering with graphical models.
Exact inferenceConditional independencies Given a probability distribution p(X,Y,Z,W), How can we decide if the groups of variables X and Y are “conditionally independent” from each other once the value of the variables Z is assigned ? With graphical models, we can implement an algorithm reducing this global problem to a series of local problems (see Matlab demo of the Bayes-Ball algorithm)
Exact inferenceVariable elimination and Distributive Law p(x1,…,x6,x7)=p(x4|x1,x2)p(x6|x4)p(x5|x4) p(x3|x2)p(x7|x2,x5) Marginalize over x7: X1 X2 p(x1,…,x6)=S x7 [p(x4|x1,x2)p(x6|x4)p(x5|x4) p(x3|x2)p(x7|x2,x5)] X3 X3 X4 X4 Applying a “distributive law”: X7 p(x1,…,x6)=p(x4|x1,x2)p(x6|x4)p(x5|x4) p(x3|x2)S x7 [p(x7|x2,x5)] X5 X5 X6 The language of graphical models allows a general formalization of this method.
Exact inferenceJunction graph and message passing Group random variables which are “fully connected”. Connect group-nodes with common members: the “junction graph”. Every node only needs to “communicate” with its neighbors. If the junction graph is a tree, there is a “message passing” protocol which allows exact inference.
Plan for the class • Introduction to Graphical Models (Polito) • Basics on graphical models and statistics • Learning from data • Exact inference • Approximate inference • Applications to Vision (Perona) • Applications to Coding Theory (McEliece) • Belief Propagation and Spin Glasses
Approximate inference • Kullback-Leibler divergence and entropy. • Variational methods. • Monte Carlo Methods. • Loopy junction graphs and loopy belief propagation. • Performance of loopy belief propagation. • Bethe approximation of free energy and belief propagation.
Approximate inferenceKullback-Leibler divergence and GM The graphical model associated to a P.D. p(x) is too complicated. AND NOW ?!?!? We choose to approximate p(x) with q(x), obtained by making assumptions on the junction graph corresponding to the graphical model. Example: eliminate loops, bound the number of nodes linked to each node. A good criterion for choosing q: mimimize the cross-entropy, or Kullback-Leibler divergence:
Diseases: d1,d2,d3 Symptoms: f1,f2,f3,f4 p(f|d)=P p(fi|d) P p(di) Approximate inferenceVariational methods Example: the QMR-DT database By using the inequality: We get the approximation: The node fi is “unlinked”:
Approximate inferenceLoopy belief propagation When the junction graph is not a tree, inference is not exact: roughly speaking, a message might pass through a node more often, causing trouble. However, in certain cases, an iterated application of a message passing algorithm converges to a good candidate for the exact solution.