Download
1 / 1
10 likes | 259 Vues
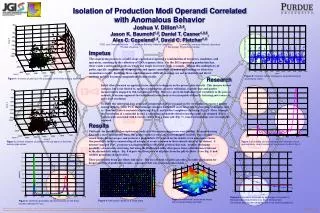
Isolation of Production Modi Operandi Correlated with Anomalous Behavior. Joshua V. Dillon 1,3,4 , Jason K. Baumohl 1,2 , Daniel T. Casner 1,3,5 , Alex C. Copeland 1,2 , David C. Pletcher 1,3.

E N D
Isolation of Production Modi Operandi Correlated with Anomalous Behavior Joshua V. Dillon1,3,4, Jason K. Baumohl1,2, Daniel T. Casner1,3,5, Alex C. Copeland1,2, David C. Pletcher1,3 1 DOE Joint Genome Institute 2 Lawrence Berkeley National Laboratory 3 Lawrence Livermore National Laboratory 4 Purdue University 5 Rensselaer Polytechnic Institute Research Results Impetus The sequencing process is a multi-stage operation requiring a combination of resources, machines, and operators, resulting in the collection of DNA sequence data. On the JGI sequencing production line, there exists a network of paths in which any single traversal yields a sample. Within this multiplicity of paths, specific combinations of operations and inputs contribute to under-performing or otherwise anomalous results. Isolating these combinations is difficult as many are not actualized and direct analysis quickly becomes computationally intractable. Initial efforts focused on applying factor analysis techniques on the process data directly. This massive dataset contains, but is not limited to, operator information, resource utilization, machine logs and quality measurements mapped to 384-well plates of DNA. However, given the high degree of variability in the process network, it became apparent that traditional factor analysis was incapable of directly inferring root causes at plate-level resolution. To make this inferential leap, principal component analysis was used on the correlation of sequence quality among samples. After PCA, the dominant subspace lends itself more favorably to clustering techniques such as “k-means” (aka k-centroids) clustering (Fig. 1) and farthest neighbors clustering (Fig. 2). Then, through the convolution of a unimodal kernel, a continuous probability density function (pdf) was obtained (Fig. 3). Using k pdfs associated with k classes, rather than a single pdf (Fig. 7), causal relationships were strategically explored. Until now, the possibilities for exploratory analysis of the sequencing process were limited. By preprocessing data into a more manageable form, this project makes several analysis techniques feasible. One can now return to the dataset proper, and perform a probabilistic PCA based on the density of an anomalous cluster. One possibility involves enumerating all n-tuples of events common to that reduced subset of the dataset. A memory-mapped I/O C program was implemented to efficiently perform this task. Another intriguing possibility also involves clustering, but using the Kullback-Leibler divergence from a distribution of interest as the dissimilarity metric. Fig. 8 depicts the divergence of all plates from the pdf of cluster 2 (see Fig. 3) and exhibits promising characteristics. These possibilities bring our efforts full-circle. The use of latent variables provides a feasible mechanism for deeper analysis of production trends—a prospect that was previously intractable. Figure 1: k-means clustering in the subspace of the three leading eigenvalues Figure 8: Kullback-Leibler divergence; proposed analysis dissimilarity metric Figure 4: well quality values for a single plate Figure 7: probability density estimate over all plates; this is approximately (due to sampling)the mixture of pdfs of Fig. 3 Figure 2: farthest neighbor clustering in the subspace of the three leading eigenvalues Figure 5: multimodal, multivariate stress test of kernel density estimator Figure 3: estimated probability density functions for the three clusters depicted in Fig 2. Figure 6: information conveyed by each eigen component; if the eigenvalue drops below one, the rv conveys less information than its own variability, and is not used for projection This work was performed under the auspices of the US Department of Energy's Office of Science, Biological and Environmental Research Program, and by the University of California, Lawrence Livermore National Laboratory under Contract No. W-7405-Eng-48, Lawrence Berkeley National Laboratory under contract No. DE-AC02-05CH11231 and Los Alamos National Laboratory under contract No. DE-AC52-06NA25396. UCRL-POST-223469 LBNL-61343-Poster