Download
1 / 44
440 likes | 742 Vues
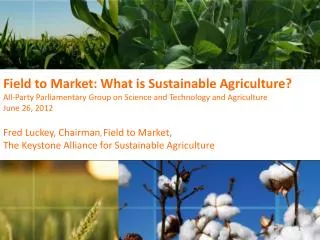
Field to Market: What is Sustainable Agriculture? All-Party Parliamentary Group on Science and Technology and Agriculture June 26, 2012 Fred Luckey, Chairman , Field to Market, The Keystone Alliance for Sustainable Agriculture. The Challenges Ahead.

E N D
Field to Market: What is Sustainable Agriculture? All-Party Parliamentary Group on Science and Technology and Agriculture June 26, 2012 Fred Luckey, Chairman, Field to Market, The Keystone Alliance for Sustainable Agriculture
“Sustainable development is development that meets the needs of the present without compromising the ability of future generations to meet their own needs.” • (Brundtland Report, 1987) Economic Development Social Responsibility Environmental Responsibility
Baseline and generally accepted observations and assumptions: • Population is growing • Economic growth in developing countries is happening • People are moving • Diets expected to improve • Food production will have to increase substantially to meet demand • Global trade must flow and grow for supply to match demand • Resources are not infinite, ecosystems biodiversity and the climate must be protected.
These are global issues that have to be overcome in an environment where: • Already at least 1 billion of the near 7 billion people on the planet malnourished • Millions are over-nourished • Local focus and interest is a priority for most • The World is more interconnected than ever • Global views and responses are not aligned – lack of consensus • Traditional market based economic systems may, or may not solve the larger issues • Infrastructure is a problem • General lack of confidence in governments to find solutions • Supply and demand in balance equal more market volatility • Time is short • Collaboration must result in action, not just talk
Demand Driven by Demographics Source: UN 6
Challenges for Increased Production • Developing areas will need to increase production • Breadbasket areas like the U.S. will need to continue to increase production • All while sustaining environmental, social, and economic well-being
What is Field to Market? • A collaborative stakeholder group • Producers, agribusinesses, food and retail companies, conservation associations, universities, and NRCS • Identifying supply chain strategies to define, measure, and promote continuous improvement for agriculture • Addressing the challenge of increasing demand and limited resources • Developing and piloting outcomes-based, science-based metrics and tools • Fieldprint Calculator, a free, online tool to help growers analyze their operations and help the supply chain explain how food is produced • National Report on environmental and socioeconomic trends over time for U.S. commodity crops • www.fieldtomarket.org
How We Define Sustainable Agriculture • Meeting the needs of the present while improving the ability of future generations to meet their own needs • Increasing productivity to meet future food and fiber demands • Improving the environment • Improving human health • Improving the social and economic well-being of agricultural communities
Big Ideas • Engage the full supply chain • Include producers • Focus on commodities crops • Unique supply chains and traceability issues • Develop science- and outcomes-based measures • Identify the key indicators for sustainability • Measure broad-scale trends and field-scale outcomes • Scale and implement metrics for sustainability programs
Deliverables: What We Are Doing Public data and models Collaboratively developed Outcomes based
The Fieldprint Calculator: Measuring Field Level Outcomes and Identifying Opportunities for Improvement 14
What is the Fieldprint Calculator? • An online education tool for row crop farmers that indexes their agronomics and practices to a fieldprint • Helps growers evaluate their farming decisions and compare their sustainability performance • In the areas of: • Land use • Soil conservation • Soil carbon • Water use • Energy use • Greenhouse gas emissions • Water Quality and Biodiversity in development • Against: • Their own fields • Their own performance over time • County, state and national averages
Field to Market Calculator Pilot Projects • Demonstrate use of calculator on the ground to test utility at the grower level and through the supply chain • Currently 6 member-led pilots engaging farmers across geographies, crops, and supply chains • Over approximately 300 farmers engaged
Pilot Feedback “I’ll tell you, I wish I had this tool when I first started my position here at the District. It’s a great way to get to know growers and local operations and to get a conversation started. I’m making more in-roads with the fieldprinting project, than I have with much of the previous outreach I’ve done. If it’s used as nothing more than an outreach tool, it’s a winner.” – Jared Foster, Van Buren Conservation District/Paw-Paw pilot
Field to Market Pilot:Completing The Supply Chain Inputs Ag Production Aggregation Intermediate Processing Food Processing Distribution Consumption Seed Fertilizer Grower 21
Objective: Using FTM tools and resources to complete the carbon and water footprints for Kellogg’s Frosted Flakes supply chain by capturing the grower link and to collect the necessary data to raise the FieldprintCalculator to a higher level of functionality Nebraska Corn Pilot: - Collaboration Process: • Establish a representative grower database • 22 growers representing 35-40% of Crete corn grind (40,000 acres) • Additional participation and support of: • National Resource and Conservation Service (NRCS) • National Corn Growers Association (NCGA) • Nebraska Corn Board • University of Nebraska Extension Service • Collect data from farm production of corn. 22
Irrigated Corn 2009, Crete Nebraska – Average Field Print and Grower ID No. 1 25
Nebraska Food Chain Pilot: Greenhouse Gas Emissions & Water Usage Inputs Ag Production Aggregation Intermediate Processing Food Processing Distribution Consumption Seed Fertilizer Grower 53,594 Short Tons GHG 232,145,565 Gal Water 4,764 Short Tons GHG 5,420,270 Gal Water 3,062 Short Tons GHG 458,348,017 Gal Water Total 2009 Greenhouse Gas Emissions = 62,533 Short Tons Total 2009 Water Usage = 695,913,852 Gal 26
Sustainability PerformanceCurve Performance Shift Accelerating Better Practice Adoption Field To Market Pilots Today Tomorrow But…How do we know the curve is moving? Oats Corn Beans Wheat Rice 27 27
National Indicators:The Sustainability Story of U.S. Agriculture
2012 Preliminary Results*: Environmental Indicators*To be published July, 2012; do not cite or publish in advance of July 12, 2012 • All six crops demonstrated progress in resource use/impact per unit of productionon all five environmental indicators. • Improvements in efficiency were driven, at least in part, by improvements in yield for all crops. • Efficiency per unit of production helps track resource uses vs. production/demand concerns
2012 Preliminary Results*: Environmental Indicators*To be published July, 2012; do not cite or publish in advance of July 12, 2012 • Absolute resource use/impact increased for some crops on some indicators. • Due in part to overall increases in production • Many factors and caveats to consider • Total use does not equal total impact • Impact often occurs on the local level • Cumulative use across all crops may reveal trade-offs due to shifting of planting patterns
2012 Preliminary Results*: Environmental Indicators*To be published July, 2012; do not cite or publish in advance of July 12, 2012 • Recent trends generally consistent with overall 30 year trends • Some exceptions: • Soil erosion (total, per acre, and per unit of production) improved nearly universally for these crops. • More recent trends show increases in total soil erosion (due to increased production) and leveling off of per acre soil erosion.
2012 Preliminary Soybean Results*Resources per bushel *To be published July, 2012; do not cite or publish in advance of July 12, 2012
2012 Preliminary Rice Results* *To be published July, 2012; do not cite or publish in advance of July 12, 2012
Where You Stand Depends Upon Where You Sit Too Late Agribusiness Government Growers Food Processors/Retailers NGOs Academia Consumer Historically 2050
The Only Path Forward Is A Common Path Agribusiness Government FTM NISA Growers TSC Food Retailers SAI SFL NGOs SISC Academia CGF Consumer Yesterday Today Tomorrow
International Adoption • Canada • Brazil • Argentina • Spain
U.S. Producers Have a Great Story to Tell • Efficiency gains over time, along with increased production • Continued challenges ahead for meeting increased demand within limits of natural resources and social and economic needs • With the collaboration of U.S. farmers, tools and metrics are emerging to help track and communicate progress and identify opportunities for continued improvement
In Summary • Imperative we produce more with the resources we have now • Zero sum game if we do not do so sustainably • Supply shocks are inevitable • Food shortages = political / economic / civil instability • Economics matter • Time is not on our side • Market volatility is likely to increase as a natural outcome • Collaboration and action are the first order of business • Not just government responsibility – it is ours as well • Imperative we imbed sustainability deeply into our strategic thinking
Microsoft Path Forward • Acknowledge preferences • Respect differences • Listen • Learn • Exert leadership • Move ahead together
Questions/Contact Information Fred Luckey, Chairman (314) 409-7822;fred.luckey@fieldtomarket.org Julie Shapiro, Facilitator 970-513-5830; jshapiro@keystone.org Field to Market Website Fieldprint Calculator 2012 National Report (July) http://www.fieldtomarket.org 43