Download
1 / 34
350 likes | 391 Vues
Explore the potential of wave energy with Oregon State University's expert team. Discover cutting-edge technologies, facilities, and research initiatives contributing to the development of wave power. Learn about OSU's critical role in advancing this renewable energy source for a sustainable future.

E N D
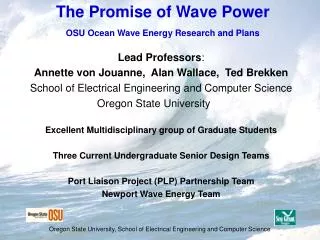
The Promise of Wave Power Wave Energy Lead Professors: Annette von Jouanne (EECS), Ted Brekken (EECS), Bob Paasch (ME), Solomon Yim (CE/Ocean), Alex Yokochi (ChE) College of Engineering, Oregon State University Excellent Multidisciplinary group of Graduate Students Three Current Undergraduate Senior Design Teams Port Liaison Project (PLP) Partnership Team Newport Wave Energy Team
Introduction Waves are a concentrated form of solar energy Technology to convert wave energy to electrical energy is in its beginning phase > 1000 Patents < 2 MW Installed Active Gov’t RD&D Program in Europe and Australia No Gov’t RD&D Program in the U.S. Demonstration in the U.S. is the Next Needed Step in the Technology Development Process
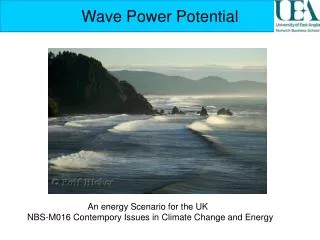
World power demand is constantly increasing. It is estimated that if 0.2% of the ocean’s untapped energy could be harnessed, it could provide power sufficient for the entire world. Compared to other renewables, wave energy advantages: higher energy density, availability (80 – 90%) and predictability. OSU is an Excellent Location to conduct ocean wave energy extraction research: Motor Systems Resource Facility (MSRF) O.H. Hinsdale Wave Research Lab Hatfield Marine Science Center Wave energy potentials of the Oregon coast Introduction
Point Absorber Wave Energy Extraction Technologies Oscillating Water Column Overtopping Attenuator
Oscillating Water Column Wavegen Limpet 500kW
Wave Damper • The Pelamis by Ocean Power Delivery (Scotland) • 150 meters long, 3.5 meters wide • 5 segments • 750 kVA
Overtopping Danish Wave Dragon 4MW
OSU Facilities to Advance Wave Energy Motor Systems Resource Facility (MSRF) O.H. Hinsdale Wave Research Lab (HWRL)
OSU - Key Location for Wave Energy Research • 750 KVA Adjustable Power Supply • Variable Voltage input(0-600Vac), 600A • 3-phase adjustable (while loaded) for balanced and unbalanced testing • Highest Power University Lab in the Nation • Enables Multi-Scale energy research • Four Quadrant Dynamometer • Programmable torque/speed • Dynamic Vector Controls 0-4000 rpm • Bidirectional Grid Interface • Regeneration back to the utility grid • Flexible, 300 hp,Motor/Generator test-bed • 120KVA programmable source • Transient VLrms=680V • Steady State VLrms= 530V • Frequency range: 45Hz to 2KHz Motor Systems Resource Facility (MSRF)
OSU - Key Location for Wave Energy Research • O.H. Hinsdale Wave Research Lab (HWRL) • Dimensions:342ft long,12ft wide, 15ft deep • Wave period range: 0.5 to 10 seconds • Max. Wave: 1.6 m (5.2 ft) @ 3.5 sec
Power From Ocean Waves • Wave energy is strongest on the west coast and increases toward the poles. kW/m crest length
Power From Ocean Waves kW/m crest length
Power From Ocean Waves - Oregon Data buoys are 2-200mi off shore, with waves traveling 15-20mph, gives 10+ hours forecast time for buoy generators located 2 mi out Seasonal variation – Good match for the NW load demand (wave data From National Data Buoy Center, Power estimated from 5 buoys off the Oregon coast over past 10 years) Power from a wave is W/m of crest length (distance along an individual crest) = the density of sea water = 1025 kg/m3 g = acceleration due to gravity = 9.8 m/s/s T = period of wave (s) (averages 8s in the winter to 6s in the summer) H = wave height (m) (averages 3.5m in the winter to 1.5m in the summer)
Power From Ocean Waves - Oregon Oregon 2004 Est. Avg Consumption Generation West of Cascades: 3,511MW (69%) 2,509MW (28%) (1002MW deficit) East of Cascades: 1,606MW (31%) 6,515MW (72%) Total: 5,117MW 9,024MW Most of the generation is in unpopulated areas. From the previous slide (Winter avg is 50kW/m, Summer avg is 10kW/m), Considering an overall average of 30kW/m and an Oregon coastline of 460km, the total Oregon coast Wave Energy potential is in the range of 13,800MW Up to about 2000MW could be provided with no additional transmission requirements (can take advantage of existing infrastructure) Oregon goal for 25% renewables by 2025 (this goal could be 50% satisfied by wave energy based on current consumption)
EPRI Study - Seven Oregon Sites Astoria Garibaldi Newport Cushman Reedsport Coos Bay Brookings
No or few working seals: generators respond directly to the movement of the ocean by employing magnetic fields for contact-less mechanical energy transmission, and power electronics for efficient electrical energy extraction. Direct drive: direct coupling of the buoy’s velocity and force to the generator without the use of hydraulic fluid or air. This simplifies and increases efficiency. Devices must be survivable, reliable, and maintainable with efficient and high-quality power take-off systems. OSU’s Novel Direct Drive Buoy Approaches Permanent Magnet Linear Generator Contact-less Force Transmission Permanent Magnet Rack and Pinion Drive
PMLG • Armature moves relative to Translator (6 inch stroke) • Armature Connected to buoy • Translator connected to anchor line
Tubular construction Coils Wound onto thin wall scaffold 18 AWG coils, wound with Epoxilite End caps transmit armature thrust Armature wires exit from end cap PMLG - Armature
Neodymium-Iron-Boron 35MGOe Magnets ASTM A848 iron pole tips, Threaded ID Center Aluminum shaft, Threaded 3/4-10 Pole tips capture magnets and distribute thrust 320mm total length, 45mm OD PMLG - Translator
PMLG - Buoy and Support Structure • 15” Dia. 3034 PVC Pipe • Bearings on centerline • Spring - energy storage and return stroke • Flanged access at top • Splined lower shaft (prevent -rotation)
Five adjustable parameters Buoyancy Cable tension Spring used Wave characteristics Load Optimal setup: 4.25 ft wave, period of 3 seconds Added buoyancy (No slack in moor) 27 lb/inch spring with 2.5 inch preload Resistance of 5 ohms PMLG - Testing
Peak Power Output = 50 Watts (25 Watts per phase) Vout = 20 Volts, I = 1.2 Amps PMLG - Testing
Looking Forward - Linear Test Bed • Mimics the wave action to test wave energy devices • A carriage actuated by a belt and pulley system moves the float relative to the spar. • 10kW with a 50% efficient device, and up to 19kW @ 95% efficiency • 1m/sec @ 20,000 N Thrust (4500 lbf) • 2m/sec @ 10,000 N Thrust (2250 lbf) • Modes: Velocity, Point-Point, & Force Control (through feedback from load cells/force meters) • 2m relative motion/stroke (6.5 feet) • Upper & Lower Gimbal mounting (for alignment variation) • 14ft tall x 10.5ft wide x 8.5ft deep
Looking Forward - Grid Connection • 2,000 MW capacity infrastructure already exists.
Looking Forward - Advanced Modeling Techniques Fluid to Moving Structure Interaction(coupled fluid-structure interaction) Buoys heaving in waves, using Finite Volume Computational Fluid Dynamics Solver (COMET) (Finite Element/Volume Mesh Analysis)
OSU’s Multidisciplinary Wave Energy Team is Pursuing Wave Energy Innovation in Three Thrust Areas • Researching novel direct-drive wave energy generators • Developing an action plan for a National Wave Energy Research and Demonstration Center in Oregon (Goal) • Essential for the U.S. to be a leader in wave energy • Currently very little investment by Federal Government/DOE compared to the rest of the world • Working closely with the Oregon Department of Energy (ODOE) and a variety of stakeholders to promote Oregon as the optimal location for the nation’s first commercial wave parks.
Wave Energy Park Environmental Issues • Effects of Electromagnetic Fields: • Sea bird attraction? • Marine Mammal attraction, repulsion. Changes in whale migration pathways. • Change in larval dispersion. • Change in fish use of area, change in fish migration, change in fish reproductive success. • Shark attraction. • Effects from construction/deployment/service of cables • The most destructive aspect of laying natural gas lines is during the deployment of lines; the seafloor with its inhabitants are altered as the line is laid with large machinery. Similar effects could be expected with lying of electric cables if similar methods are used. • Impact on invertebrates or seafloor structure from placement of anchors and power lines. • Creation of a sediment plume and resulting impacts on fish/invertebrates. • Effects of the physical structure of the buoy field. • Entanglement of marine mammals: whales, dolphins. • Effects of using antifouling agents: introduction of toxics. • Creation of a new community: • Does the new structure act as a filter for larval dispersal so that recruitment in surrounding areas is decreased? • Will the structure create a new habitat that will facilitate recruit and production of marine organisms? HMSC will have a conference on wave energy environmental impacts in April, 2007.
Oregon’s Competitive Advantage • Unique ocean resource • Established marine community • Excellent reputation for renewable energy and green industry support • Positive political climate (both state & federal) “Oregon is poised to lead the nation and the world in wave energy development. We have the wave resource, the expertise through collaboration including tremendous industry, utility and community support, and the utility infrastructure along the coast to deliver this clean, renewable power into the grid.” -- Dr. Annette von Jouanne