
Assessing Uncertainty in Global Atmospheric Methane Distribution Using AQUA/AIRS and GMI CTM
This study evaluates the global distribution of atmospheric methane, focusing on discrepancies between data from NASA’s AQUA satellite's Atmospheric Infrared Sounder (AIRS) and the Global Modeling Initiative's Chemistry and Transport Model (GMI CTM). Findings indicate that while there is good agreement near the surface, significant uncertainties exist, particularly in tropical convection areas and with conversions in the model. The comparison aims to identify critical regions where improvements can enhance the accurate modeling of methane emissions.

Assessing Uncertainty in Global Atmospheric Methane Distribution Using AQUA/AIRS and GMI CTM
E N D
Presentation Transcript
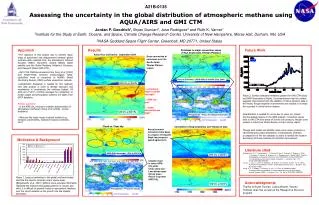
A21B-0135 Assessing the uncertainty in the global distribution of atmospheric methane using AQUA/AIRS and GMI CTM Jordan P. Goodrich1, Bryan Duncan2, Jose Rodriguez2 and Ruth K. Varner11Institute for the Study of Earth, Oceans, and Space, Climate Change Research Center, University of New Hampshire, Morse Hall, Durham, NH, USA 2NASA Goddard Space Flight Center, Greenbelt, MD 20771, United States Results Future Work • Approach • The objective of this project was to identify major areas of agreement and disagreement between global methane data collected from the Atmospheric Infrared Sounder (AIRS) instrument aboard NASA’s AQUA satellite and the Global Modeling Initiative’s Chemistry and Transport Model (GMI CTM). • GMI CTM: Methane emissions from Fung et al. [1991] and GEOS-4-DAS archived meteorological fields. Latitudinal trend is compared to NOAA’s Global Monitoring Division (GMD) surface observation network. • AQUA/AIRS: Evaluation is needed for this relatively new data product in order to identify strengths and weaknesses in constraining the methane budget. All plots are 2°x2.5°, monthly averages for comparison to model output and precipitation patterns are taken from GPCP database. Primary questions: • Is the AIRS CH4 retrieval a credible representation of atmospheric methane? (Xiong et al. [2008] – known problems) • What are the major issues in global models (e.g., emission uncertainties, excessive tropical convection, etc.)? Problems in major convection zones (ITCZ, South Asia, Tibetan Plateau) Asian Rice Cultivation: September 2004 Deep convection of emissions over the South Asian/ Tibetan Plateau region. Percent Difference (AIRS-GMI) at 300hPa (Sep. 2004) AIRS CH4 at 300hPa • emissions input to model too high? • AIRS too low? • model convection too high? Figure 2. Surface latitudinal methane gradient for GMI CTM (blue) and GMD observations (black). Good agreement near the surface suggests improvement with the addition of online emission data in the model, though stepwise improvements are needed to increase the accuracy in critical source regions. Quantification is needed for errors due to snow, ice, clouds and low albedo regions in the AIRS product. Convection issues exist in GMI CTM over areas of chronic low pressure, though some success is noted over Boreal Russia, a major source region. Though both model and satellite retain some major problems in representing the global distribution of atmospheric methane, a comparison of the two datasets is useful to identify the location and nature of these problems for directed improvement. GMI CH4 at 300 hPa Precipitation – Proxy for Clouds/Convection Cloud vs. Clear sky Convection of bog emissions over Russia in July Boreal summer emissions from bogs In a region of frequent Weak low pressure (good agreement) Motivation & Background Literature cited AIRS-GMI: November %Diff @ 525hPa Bergamaschi, P., C. Frankenberg, J. F. Meirink, M. Krol, F. Dentener, T. Wagner, U. Platt, J. O. Kaplan, S. Korner, M. Heimann, E. J. Dlugokencky, A. Goede (2007), Satellite chartography of atmospheric methane from SCIAMACHY on board ENVISAT: 2. Evaluation based on inverse model simulations, J. Geophys. Res., 112, doi:10.1029/2006JD007268. Fung, I., J. John, J. Lerner, E. Matthews, M. Prather, L. P. Steele, and P.J. Fraser (1991), Three-dimensional Model synthesis of the global methane cycle, J. Geophys. Res., 96, 13,033-13,065. Xiong, X. Z., E. Maddy, C. Sweeney, X. Liu, L. H. Zhou, M. Goldberg (2008), Characterization and validation of methane products from the Atmospheric Infrared Sounder (AIRS), J. Geophys. Res., 113, doi:10.1029/2007JG000500. AIRS CH4 at 300hPa Clouds result In lower AIRS CH4 while Clear skies over Low albedo open Ocean areas Result in greater AIRS CH4 Figure 1. Largeuncertainties in the globalmethane budget illustrate the need to constrain major source areas [Bergamaschi et al. 2007].Without more accurate information regarding the temporal and spatial patterns of sources and sinks, it is difficult to quantify trends in atmospheric methane over the recent decades as the growth rate has steadily decreased. Acknowledgments GMI CH4 at 300hPa Thanks to Bryan Duncan, Juying Warner, Yasuko Yoshida, Qian Tan as well as the Research & Discover program Precipitation – Proxy for Clouds