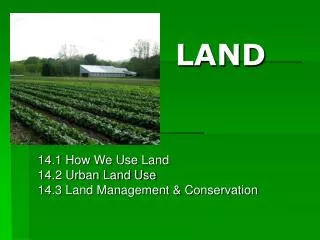
Land Use: Globally consistent national mitigation and adaptation
200 likes | 363 Vues
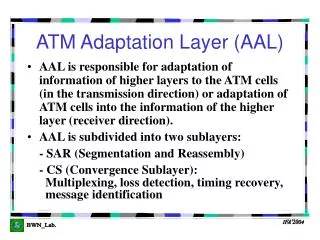
Land Use: Globally consistent national mitigation and adaptation. Michael Obersteiner. GLOBIOM Global Biosphere (Optimization) Model. AGRICULTURE. FOREST. OTHER. =. DEMAND. SUPPLY. Livestock. Bioenergy. Forest Products. Ind.Roundwood Firewood Biomass 4 Energy. 60 Crops

Land Use: Globally consistent national mitigation and adaptation
E N D
Presentation Transcript
Land Use: Globally consistent national mitigation and adaptation Michael Obersteiner
GLOBIOM Global Biosphere (Optimization) Model AGRICULTURE FOREST OTHER = DEMAND SUPPLY Livestock Bioenergy Forest Products Ind.Roundwood Firewood Biomass 4 Energy 60 Crops 6 Input Systems Modèles biophysiques G4M EPIC Land (type de sol, altitude, inclinaison, climat,système d’exploitation)
Presentation of the model • With a focus on Congo Basin • 1550 Simulation Units from10*10km to 50*50 km • Detailed infrastructure network Global coverage • 28 regions • Endogenous prices • Bilateral trade flows
Model application Simulation horizon: 2000–2030 Scenarios • Biofuels • Mead • Technological change • Infrastructure improvement Sensitivity analysis : REDD policy • 50%, 75%, 90% reduction of global deforestation compared to the situation Business As Usual (BAU)
Model application • Infrastructure scenario Transport time with completed Trans-African Road network Transport time with existing infrastructure Scenario Average = 40 hours Average = 23 hours
Deforestation after infrastructure improvement [1000 ha/SimU/10 years] I: Regional zooming - CongoBIOM Green = low Red = high
Deforestation Impact • Deforested area in Congo Basin in 2030 (Mio. Ha)
Food Security • Crop price index
Mitigation through Yield Improvements • Input neutral yield growth • Plant material • Pest and disease management • Input based yield growth • Subsistence, extensive, intensive, irrigated intensive • Productivity gains by geographic allocation of production • Trade
REDD+ and Agriculture based Mitigation 100% 71% 52% 41%
Global Wheat Trade 2050 % of Baseline % of total production
Global Energy Portfolio – 1.5-2DG target Source: Azar et al. 2010
Bioelectricity from CHP Heat&Cooking 2ndGennTransportfuels
Challenges • Embodied technology transfer through FDI • International capital transfer • Trade liberalization • Get supply chains climate smarter such that funding reaches the ground improved agricultural practices (e.g. roundtables and certification [CGF]) => lower prices and price volatility • more environmental services not only GHGs • adaptation co-benefits