Download
1 / 5
50 likes | 202 Vues
COMPARATIVE ACCURACY OF DIVIDEND DISCOUNT MODELS. By Adam Gehr, Professor, DePaul University Rawley Thomas, President, LifeCycle Returns March 12, 2004 agehr@mozart.depaul.edu Rawley@LCRT.com. AN EQUITY RISK PREMIUM (ERP) = 1.0 PRODUCES THE LOWEST TRACKING ERROR. Cumulative % of Universe.

E N D
COMPARATIVE ACCURACY OF DIVIDEND DISCOUNT MODELS By Adam Gehr, Professor, DePaul University Rawley Thomas, President, LifeCycle Returns March 12, 2004 agehr@mozart.depaul.edu Rawley@LCRT.com
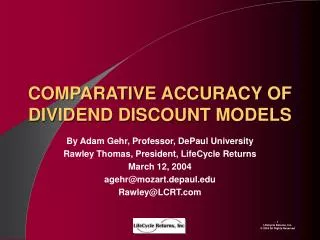
AN EQUITY RISK PREMIUM (ERP) = 1.0 PRODUCES THE LOWEST TRACKING ERROR Cumulative % of Universe LOG2 of % Absolute Model Error versus Actual Price - Fiscal Year +3 Months 1994-2002 54 61 78 Tracking error equals the % absolute difference between the Model Intrinsic Value and the actual stock price at Fiscal Year + 3 Months. The Chart compares models, methodologies, or parameters. Sources: Financial Statements and Price Data – Simplystocks Calculations - LCRT’s Platform 2.010 Company-Years
PRACTICALLY NO DIFFERENCE EXISTS BETWEEN MEDIAN INDUSTRY BETA’S, LCRT BETA’S OR BETA = 1.00 Cumulative % of Universe LOG2 of % Absolute Model Error versus Actual Price - Fiscal Year +3 Months 1994-2002 52-54 Tracking error equals the % absolute difference between the Model Intrinsic Value and the actual stock price at Fiscal Year + 3 Months. The Chart compares models, methodologies, or parameters. Sources: Financial Statements and Price Data – Simplystocks Calculations - LCRT’s Platform 2.010 Company-Years for Industry Beta & Beta = 1.00 1,989 Company-Years for LCRT Beta
WITH THE SAME SAMPLE OF ~2,000 COMPANY-YEARS, LCRT IS 71.1% (=100%(53.7/31.4-1)) MORE ACCURATE THAN DDM AND 13.2% (=100%(53.7/47.4-1)) MORE ACCURATE FOR 20,947 LCRT COMPANY-YEARS WITH C$GI > 100 $MILLION Cumulative % of Universe LOG2 of % Absolute Model Error versus Actual Price - Fiscal Year +3 Months 1994-2002 31 47 54 Tracking error equals the % absolute difference between the Model Intrinsic Value and the actual stock price at Fiscal Year + 3 Months. The Chart compares models, methodologies, or parameters. Sources: Financial Statements and Price Data – Simplystocks Calculations - LCRT’s Platform 2.010 Company-Years for DDM 1,995 to 20,947 Company-Years for LCRT
LCRT’S MODEL IS 90% MORE ROBUST THAN THE DIVIDEND DISCOUNT MODEL (DDM) LCRT DDM Sources: Financial Statements and Price Data – Simplystocks Calculations - LCRT’s Platform Constant Dollar Gross Investment > $100 Million