Download
1 / 21
210 likes | 343 Vues
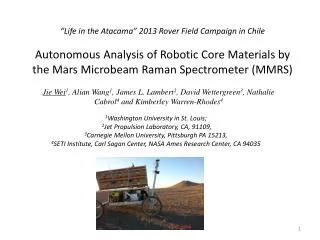
“Life in the Atacama” 2013 Rover Field Campaign in Chile Autonomous Analysis of Robotic Core Materials by the Mars Microbeam Raman Spectrometer (MMRS) . Jie Wei 1 , Alian Wang 1 , James L. Lambert 2 , David Wettergreen 3 , Nathalie Cabrol 4 and Kimberley Warren-Rhodes 4.

E N D
“Life in the Atacama” 2013 Rover Field Campaign in Chile Autonomous Analysis of Robotic Core Materials by the Mars Microbeam Raman Spectrometer (MMRS) • Jie Wei1, AlianWang1, James L. Lambert2, David Wettergreen3, Nathalie Cabrol4 and Kimberley Warren-Rhodes4 1Washington University in St. Louis; 2Jet Propulsion Laboratory, CA, 91109, • 3Carnegie Mellon University, Pittsburgh PA 15213, 4SETI Institute, Carl Sagan Center, NASA Ames Research Center,CA 94035
Outline Background Methodology: sampling & measurements Performance of MMRS (robustness ) Minerals identified Quantitative analysis: phase distributions Conclusion
Background • Life in the Atacama (NASA , ASTEP program) Atacama desert: one of the driest deserts; a terrestrial analog to Mars. Different forms of life were previously identified at Atacama subsurfaces. LIFA 2013 campaign, rover-based exploration: robotic subsurface sampling, autonomous mineral phase identification. Operation: Remotely directed Field team: Rover, Drill, MMRS
Background • Mars Microbeam Raman Spectrometer (MMRS) for fine-scale mineralogy and biosignature 1996 NASA PIDDP 1997 Athena payload for Mars Exploration Rover mission 2004 MSL payload selection (category one) 2012 LITA project, MMRS stand-alone 2013 LITA project , MMRS on Zöe rover
Methodology Manually collected from pit wall • Sample collections Automatically delivered by drill • Measurements: MMRS main box MMRS probe head Line-scan of the same samples using HoloLab5000 (similar performance as MMRS) Autonomous line-scan of samples on carousel
Micro (focused) beam with line scan fine grain mineralogy Raman spectroscopy • Point counting method: • Taking spectra from many spots using focused beam • Each assignable spectrum is added to the phase count h Non-invasive Non-destructive In situ application
Measurement summary Locations and depths • 7 locations, 31 samples • 62 measurements (mmrs, lab) • Total 3230 points (spectra) . Linear-scan points 8-11 2 5,6B
MMRS Robustness MMRS normal performance remained over 2-week 50 km route Naphthalene spectra at the beginning and end of the trip Blue: 06/17 15:09 Red: 06/29 20:54 • Peak position • Accounts • Relative peak intensity
Minerals identified -- 3 sulfates Gypsum (CaSO4 ∙2H2O ) For low s/n spectra, single peak at 1008 was assigned to gypsum.
Anhydrite (CaSO4) Minerals identified -- 3 sulfates
Minerals identified -- 3 sulfates in Atacama-2013 samples (a) Only observed in lab. Chio, Sharma and Muenow, American Mineralogist, 89: 390 (2004) (b) Not certainly identified in this study. From Yang, Wang and Freeman, 40th LPSC (2009): 2128
Minerals identified – K, Na-feldspar Feldspar group The Raman spectra slightly vary. The strongest Raman peaks fall within a narrow region of 505 and 515 cm-1 (a). Best assigned as ternary feldspar with most albite contribution[a]. In the MMRS spectra of Atacama samples, only the strongest peaks between 508 - 516 cm-1 show up. They are assigned to the group of feldspar. The peak positions indicate alkali-feldspars, i.e. Na & K-feldspar. [a]Freeman, Wang, Kuebler, Jolliff and Haskin, The Canadian Mineralogist, 46: 1477 (2008).
Minerals identified – two carbonates Carbonates have the strongest Raman peak, 1, between 1000 – 1100 cm-1 . Calcite (CaCO3) ??CO3 • The spectra are weak, only appeared once in the analyzed spectra, might be K2CO3 or BaCa(CO3)2. Low s/n spectra: Calcite/aragonite
Minerals identified – igneous and graphite Anatase (TiO2), quartz (SiO2) and hematite (Fe2O3) Graphite Hematite and graphite are only identified in lab-measured spectra.
V. Quantitative phase distributions: point counting method MMRS spectra Locale: 9, pit Depth= 10 cm Percentage of Informative spectra = (19+2+3) / 50 = 48 % Quartz proportion percentage = 19 / 50 = 38% (To be developed -- weighted with Raman cross section of solid phases) (a) Haskin, Wang, Rockow, Jolliff, Korotev and Viskupic, J. Geophy. Res. 102: 19293 (1997).
Percentage of informative spectra • Averaged informative percentages: Lab 48%; MMRS 29%. • Exposure time and accumulation numbers: Lab: 1000 ms x 10acc - 2000 msx10 acc; MMRS: 100ms x 10 -200ms x 20 . • Laser focus condition.
Phase distributions (Point proportion)7 sites, 31 samples, 59 measurements (non-informative measurements were removed), 1680 mmrs + 1550 lab points/spectra Mean proportional percentages Proportional percentages over depths The relative distribution of anhydrite/bassanite increases sharply at the depth of 80 cm; Gypsum prefers surface.
Conclusion • First time integration of MMRS on a rover and reliable operation over the 50 miles 2-week trip; demonstrated the robustness of its opt-mechanical construction. • Preliminary data analysis results: • Autonomous MMRS spectra of subsurface materials identified 3 sulfates, 2 carbonates, a type of feldspar, quartz and anatase (TiO2). • Reduced carbon and hematite (Fe2O3) are also identified in lab spectra. • The percentage of informative MMRS spectra (29%) is lower than lab’s (48%) (accumulation time and laser focus condition are among the reasons). • Mineral phase distributions as a function of depths show that anhydrite distribution increases abruptly at the depth of 80 cm. • Next trip to Atacama: • 1) More calibration; • 2) Better sample filling and longer measurement time; • 3) More samples and points to decrease statistical uncertainty; • 4) Immediate MMRS measurements after sample collection.
Acknowledgement • Jie Wei1, Alian Wang1, James L. Lambert2, David Wettergreen3, Nathalie Cabrol4 and Kimberley Warren-Rhodes4 CMU rover team Greydon Taylor Foil David Kohanbash James Peter Teza Srinivasan Vijayarangan Michael Wagner Honeybee Drill team Gale Paulsen Sean Chulhong Yoon Local support Guillermo Chong Jonathan Bijman Raul Arias O. Funding ASTEP (NASA ) McDonnell Center for the Space Sciences, Washington University in St. Louis
Thanks for your attention!Please visit Poster 227219 and 227240 in Hall D, 2-4 pm, 5-6:60 pmfor Raman spectroscopy detection of biomarkers and zeolites