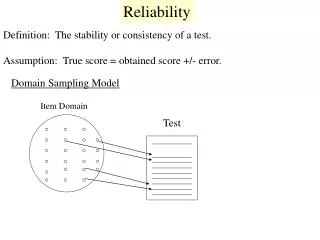
Estimating Reliability in Performance Ratings and Candidate Perceptions
This seminar series explores methods for estimating reliability in performance ratings and candidate perceptions, focusing on data analysis techniques such as Kappa, Intraclass Correlation, and Two-Way Fixed Effects. Examples include ratings of GOP debate performance, responses from presidential candidates regarding health and the economy, and patient satisfaction with doctors. The session covers various reliability models and calculations, with practical applications in assessing survey responses. The presentation also includes discussions on the reliability of individual questions and overall measures for multiple respondents.

Estimating Reliability in Performance Ratings and Candidate Perceptions
E N D
Presentation Transcript
Estimating Reliability RCMAR/EXPORT Methods Seminar Series Drew (Cobb Room 131)/ UCLA (2nd Floor at Broxton) December 12, 2011
Reliability Minimum Standards 0.70 or above (for group comparisons) 0.90 or higher (for individual assessment) SEM = SD (1- reliability)1/2
Two Raters’ Ratings of GOP Debate Performance on Excellent to Poor Scale • Bachman Turner Overdrive (Good, Very Good) • Ging Rich (Very Good, Excellent) • Rue Paul (Good, Good) • Gaylord Perry (Fair, Poor) • Romulus Aurelius (Excellent, Very Good) • Sanatorium (Fair, Fair)
Cross-Tab of Ratings Rater 2
Linear and QuadraticWeighted Kappa Wi = 1 – ( i/ (k – 1) I = number of categories ratings differ by k = n of categories W i = 1 – (i2 / (k – 1)2
Intraclass Correlation and Reliability Model Reliability Intraclass Correlation One-way Two-way fixed Two-way random BMS = Between Ratee Mean Square N = n of ratees WMS = Within Mean Square k = n of replicates JMS = Item or Rater Mean Square EMS = Ratee x Item (Rater) Mean Square 8
Reliability of Performance Ratings 01 34 02 45 03 33 04 21 05 54 06 22 Candidates (BMS) 5 15.67 3.13 Raters (JMS) 1 0.00 0.00 Cand. x Raters (EMS) 5 2.00 0.40 Total 11 17.67 Source SS MS df 2 (3.13 - 0.40) = 0.89 2-way R = ICC = 0.80 2 (3.13) + 0.00 - 0.40
GOP Presidential Candidates Responses to Two Questions about Their Health • Bachman Turner Overdrive (Good, Very Good) • Ging Rich (Very Good, Excellent) • Rue Paul (Good, Good) • Gaylord Perry (Fair, Poor) • Romulus Aurelius (Excellent, Very Good) • Sanatorium (Fair, Fair)
Two-Way Fixed Effects (Cronbach’s Alpha) 01 34 02 45 03 33 04 21 05 54 06 22 Respondents (BMS) 5 15.67 3.13 Items (JMS) 1 0.00 0.00 Resp. x Items (EMS) 5 2.00 0.40 Total 11 17.67 Source SS MS df 3.13 - 0.40 = 2.93 = 0.87 Alpha = 3.13 3.13
Overall Satisfaction of 12 Patients with 6 Doctors (2 patients per doctor) • Dr. Overdrive (p1: Good, p2: Very Good) • Dr. Rich (p3: Very Good, p4: Excellent) • Dr. Paul (p5: Good, p6: Good) • Dr. Perry (p7: Fair, p8: Poor) • Dr. Aurelius (p9: Excellent, p10: Very Good) • Dr. Sanatorium (p11: Fair, p12: Fair)
Reliability of Ratings of Doctor 01 34 02 45 03 33 04 21 05 54 06 22 Respondents (BMS) 5 15.67 3.13 Within (WMS) 6 2.00 0.33 Total 11 17.67 Source SS MS df 3.13 - 0.33 = 2.80 = 0.89 1-way = 3.13 3.13
Candidates Perceptions of the U.S. Economy in November & December, 2011 • Bachman Turner Overdrive (Good, Very Good) • Ging Rich (Very Good, Excellent) • Rue Paul (Good, Good) • Gaylord Perry (Fair, Poor) • Romulus Aurelius (Excellent, Very Good) • Sanatorium (Fair, Fair) Which model would you use to estimate reliability?
Reliability and SEM • For z-scores (mean = 0 and SD = 1): • Reliability = 1 – SE2 • So reliability = 0.90 when SE = 0.32 • For T-scores (mean = 50 and SD = 10): • Reliability = 1 – (SE/10)2 • So reliability = 0.90 when SE = 3.2
In the past 7 days I was grouchy [1st question] • Never • Rarely • Sometimes • Often • Always • Theta = 56.1 SE = 5.7 (rel. = 0.68)
In the past 7 days … I felt like I was read to explode [2ndquestion] • Never • Rarely • Sometimes • Often • Always • Theta = 51.9 SE = 4.8 (rel. = 0.77)
In the past 7 days … I felt angry [3rd question] • Never • Rarely • Sometimes • Often • Always • Theta = 50.5 SE = 3.9 (rel. = 0.85)
In the past 7 days … I felt angrier than I thought I should [4th question] • Never • Rarely • Sometimes • Often • Always • Theta = 48.8 SE = 3.6 (rel. = 0.87)
In the past 7 days … I felt annoyed [5th question] • Never • Rarely • Sometimes • Often • Always • Theta = 50.1 SE = 3.2 (rel. = 0.90)
In the past 7 days … I made myself angry about something just by thinking about it. [6thquestion] • Never • Rarely • Sometimes • Often • Always • Theta = 50.2 SE = 2.8 (rel = 0.92)
Theta and SEM estimates • 56 and 6 (reliability = .68) • 52 and 5 (reliability = .77) • 50 and 4 (reliability = .85) • 49 and 4 (reliability = .87) • 50 and 3 (reliability = .90) • 50 and <3 (reliability = .92)
Thank you. Powerpoint file posted at URL below (freely available for you to use, copy or burn): http://gim.med.ucla.edu/FacultyPages/Hays/ http://www.chime.ucla.edu/measurement/wip.htm Contact information: drhays@ucla.edu 310-794-2294 For a good time call 8675309 or go to: http://twitter.com/RonDHays
AppendicesANOVA Computations • Candidate/Respondents SS (72+92+62+32+92+42)/2 – 382/12 = 15.67 • Rater/Item SS (192+192)/6 – 382/12 = 0.00 • Total SS (32+ 42+42+52+32+32+22+12+52+42+22+22) – 382/10 = 17.67 • Res. x Item SS= Tot. SS – (Res. SS+Item SS)
options ls=130 ps=52 nocenter; options nofmterr; data one; input id 1-2 rater 4 rating 5; CARDS; 01 13 01 24 02 14 02 25 03 13 03 23 04 12 04 21 05 15 05 24 06 12 06 22 ; run; **************;
procfreq; tables rater rating; run; *******************; procmeans; var rater rating; run; *******************************************; procanova; class id rater; model rating=id rater id*rater; run; *******************************************;
data one; input id 1-2 rater 4 rating 5; CARDS; 01 13 01 24 02 14 02 25 03 13 03 23 04 12 04 21 05 15 05 24 06 12 06 22 ; run; ******************************************************************; %GRIP(indata=one,targetv=id,repeatv=rater,dv=rating, type=1,t1=test of GRIP macro,t2=); GRIP macro is available at: http://gim.med.ucla.edu/FacultyPages/Hays/util.htm
data one; input id 1-2 rater1 4 rater2 5; control=1; CARDS; 01 34 02 45 03 33 04 21 05 54 06 22 ; run; **************; DATA DUMMY; INPUT id 1-2 rater1 4 rater2 5; CARDS; 01 11 02 22 03 33 04 44 05 55 RUN;
DATA NEW; SET ONE DUMMY; PROCFREQ; TABLES CONTROL*RATER1*RATER2 /NOCOL NOROW NOPERCENT AGREE; *******************************************; data one; set one; *****************************************; procmeans; var rater1 rater2; run; *******************************************; proccorr alpha; var rater1 rater2; run;