Understanding Vector Diagrams: Displacement Calculations in Scaled Drawings
This guide explains how to create scaled vector diagrams to determine displacement. By analyzing the problem, you will identify the represented values and choose the appropriate scale for your diagram. The process includes drawing the first vector based on the scale, placing subsequent vectors at correct angles, and connecting them to find the resultant displacement. Two examples illustrate how to calculate total displacement for a bear and a car, using scales of 1 cm = 100 m and 1 cm = 1 km, respectively.
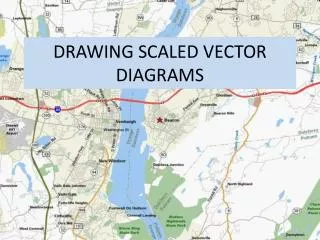

Understanding Vector Diagrams: Displacement Calculations in Scaled Drawings
E N D
Presentation Transcript
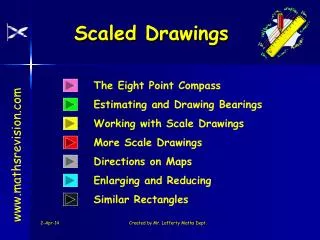
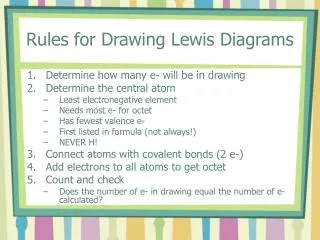
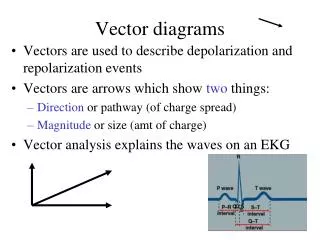
Read the problem carefully. • Determine what values are being represented. • Determine an appropriate scale and record it on the diagram. • Draw the first vector using the scale and label it. • Place the next vector at the tip of the first at the proper angle. • Connect the tail of the first vector to the tip of the second. • Use the scale to determine the value and record it on the diagram.
Ex. A bear traveled 500m due east then turned and traveled 800m due north. Find the bears displacement. Scale: 1cm= 100m 9.5cm = 950m 8.0cm = 800m 58˚ 5.0cm =500m C =950m@58˚NE
Ex2. A car travels 3.5km due north then 6.0km due east. It then travels due south 1km. What is the cars displacement ? scale: 1cm = 1km 6cm = 6km 1.0km 3.5cm= 3.5km 68˚ 6.7cm=6.7km C = 6.7km@68˚NE