WIRING DIAGRAM APPROACH
120 likes | 242 Vues
This document outlines the Wiring Diagram Approach as a framework for synthesizing research on the Arctic water cycle, emphasizing integration between disciplines to address the impacts of climate change on sea ice. By analyzing key processes, interdependencies, and uncertainties, the study aims to identify gaps in current scientific understanding and propose coherent frameworks for water budget closure. The approach illustrates how simple questions can reveal complex interactions and highlights the necessity for coordinated measurements across multiple disciplines to validate findings and articulate spatial and temporal changes.

WIRING DIAGRAM APPROACH
E N D
Presentation Transcript
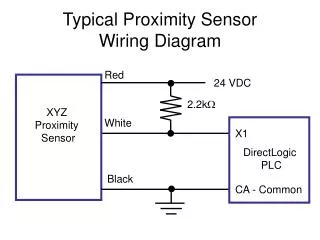
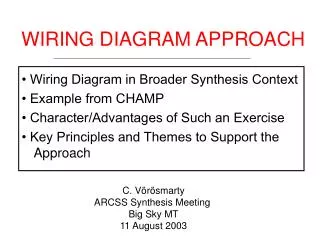
WIRING DIAGRAM APPROACH • Wiring Diagram in Broader Synthesis Context • Example from CHAMP • Character/Advantages of Such an Exercise • Key Principles and Themes to Support the Approach C. Vörösmarty ARCSS Synthesis Meeting Big Sky MT 11 August 2003
Key Processes and Linkages • Disciplinary research has studied many individual elements of the arctic water cycle • These processes are linked and inter-dependent • Major shortcoming of current science is the lack of integrative, inter-disciplinary synthesis
Arctic-CHAMP Approach to Synthesis
Q: What is the impact of climate change on sea ice? Feedback and System Sensitivity Studies(a la CHAMP) • “Simple” questions tested ---> complex interactions uncovered • Gaps identified • Playing field on which disagreements can arise • Links physics, biochemistry, biology • > 1 question can be addressed
A FIRST-ORDER ATTEMPT AT WATER BUDGET CLOSURE • Stocks, residence times • Critical but Uncertain Pathway: Atmospheric • Budget Closure Disparity Large -- Land….1700 km3 y-1 --Ocean….2800 km3 y-1 Pareto Principle • 80/20 rule • Early progress expected on “fundamentals” • What is good enough?
Validation at “Correct” Scale: P/WBM Simulation Point-scale (Calm Stations) By Broad PPT Classes Rawlins et al. (in press). Hydrological Processes
Validation: Focus on Integrative Measures • Geospatial Fields • Transects (McGuire et al. 2002) • Discharge (Peterson et al. 2002; Yang et al. 2002; Ye et al., in press) • Tree rings/ tree lines (Briffa et al. 1998, MacDonald et al. 2000), lake sediments (Rühland et al. 2003) • Coordinated Suites of Measurements (Serreze et al. 2000, Overpeck et al. 1997) • NWP, Atmospheric Models ---> potential bias but systematic computations
GEOGRAPHY AND TIMING OF CHANGE / VARIABILITY • Station-based, Observed Hydrography • Decadal-scale Changes Recorded (1970s/80s vs 90’s) • Changes Complex over Space and Time Lammers et al. 2001, JGR Atmos.
INTERCOMPARISONS ARE USEFUL IN BENHCMARKING OUR UNDERSTANDING ARCTIC OCEAN SEA ICEMODEL INTERCOMPARISON • Wide-ranging geography of results • Most have implicit FW • Differences in understanding immediately highlighted
THROTTLE POINTS: e.g. AMPLIFICATION OF PRECIPITATION UNCERTAINTY ON RUNOFF UNCERTAINTY PPT Effect Substantial Pan-Arctic Bias in Budget Closure
KEY THEMES/PRINCIPLES • Pose clear questions • An appropriate wiring diagram can be used to answer > 1 question • Stocks and fluxes: closure, error analysis, physical consistency 1st • Integrative frameworks essential • Validation: Look for integrative measures • Articulate spatial and temporal variations • Seek out potential throttles / attenuators • Intercomparison efforts (models, field results, and data fields)


![Diagram of Consensus Clustering Approach [1]](https://cdn1.slideserve.com/3340694/slide1-dt.jpg)