Download
1 / 25
250 likes | 394 Vues
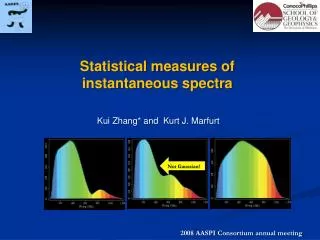
Statistical measures of instantaneous spectra. Kui Zhang* and Kurt J. Marfurt. Not Gaussian!. 2008 AASPI Consortium annual meeting. Motivation.

E N D
Statistical measures of instantaneous spectra Kui Zhang* and Kurt J. Marfurt Not Gaussian! 2008 AASPI Consortium annual meeting
Motivation • Spectral decomposition is a powerful analysis tool in tuning thickness identification, direct hydrocarbon detection, and geological facies delineation. • Spectral decomposition has limitations: • One single frequency can not accurately represent the whole spectrum. • The full 4D decomposition consumes considerable disk space and it is difficult to visualization efficiently.
Motivation • The mode is a good first-order approximation of the spectrum: • peak magnitude, • peak frequency, and • Peak phase Moment-based measures are useful for nearly-Gaussian spectra. The spectra of balanced data are NOT Gaussian. • We have developed several statistical attributes including: • bandwidth, • range-trimmed mean, • spectral slope, and • roughness
Theory High magnitude roughness slope bandwidth 0.00 Jhigh Jlow Frequency index percentile 1.00 phigh 0.50 plow 0.00 Jlow J50 Jhigh Frequency index Schematic illustration of spectral attributes
Theory • Bandwidth (as above figure) • Range trimmed mean • Spectral slope The slope that best fits the spectrum between Jlow and Jhigh • Spectral Roughness A measure of how well the spectrum is fit by a linear variation between flow and fhigh.
Let’s parameterize the spectrum to have the form (1) where, mjis the magnitude at frequency fj, m0 is the intercept, s is the slope, and (2) We formulate the misfit between our parameterized model and the data mj as E: (3) m0 and s can be obtained by solving the following equations: (4) (5)
Combining (4) and (5): (6) Where, (7a) (7b) We define the roughness as: (8)
A Amplitude Positive A’ 0 Negative pos 0 neg Seismic(time slice t=1.05s) N
A Peak magnitude Maximum A’ 0 1 km Peak magnitude N
A R-T mean Maximum A’ 0 1 km R-T mean magnitude gives higher resolution than peak magnitude Range-trimmed mean N
A Slope Positive A’ 0 Negative 1 km Slope N
A Roughness Maximum A’ 0 1 km Roughness N
A A’ 0.8 0.9 1.0 Time 1.1 1.2 1.3 Slope 1 > Slope 2 Slope 3 < 0 120
Peak magnitude Maximum 0 1 km Peak magnitude (Phantom horizon slice 40ms above the picked horizon) N
R-T mean Maximum 0 1 km Range trimmed mean (Phantom horizon slice 40ms above the picked horizon) N
R-T mean Maximum 0 1 km 1 km Range trimmed mean (Phantom horizon slice from 990ms-1040ms) N
Slope Positive 0 Negative 1 km Slope (Phantom horizon slice 40ms above the picked horizon) N
Roughness Maximum 0 1 km 1 km Roughness (Phantom horizon slice 40ms above the picked horizon) N
Amplitude Slope positive positive 0 0 negative negative 1 km 1 km Seismic amplitude (time slice t=0.88s) Slope
R-T mean Roughness maximum maximum 0 0 Oil well 1 km 1 km Range trimmed mean Roughness
Slope Curvature positive positive 0 0 negative negative 1 km 1 km Most negative curvature Slope
Conclusions Spectral slope, range-trimmed mean magnitude, and spectral roughness computed from the balanced spectra improve the interpretability of channels, Karst-modified fractures, and other features of geological interest. These measures may be sensitive to anomalous attenuation. Further modeling and comparison to logs is necessary to evaluate the sensitivity to upward-fining, upward-coarsening, and other subtle stratigraphic trends. Measures from spectral phase will be investigated.
Acknowledgement We thank all sponsors of AASPI consortium for their support. We also thank Burlington Resources and Mull Petroleum Co. for the use of their data in education and research.