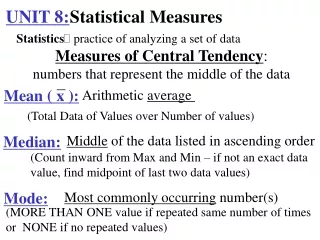
4.1 Statistical Measures
120 likes | 361 Vues
4.1 Statistical Measures. 4.1 Statistical Measures . When one needs to compare individual values to others in a data set, the following statistical measures are used: Per Capita Percent Change Percentile & Percentile Rank Weighted Mean. Per Capita.

4.1 Statistical Measures
E N D
Presentation Transcript
4.1 Statistical Measures When one needs to compare individual values to others in a data set, the following statistical measures are used: • Per Capita • Percent Change • Percentile & Percentile Rank • Weighted Mean
Per Capita • Per capita represents the average amount per person • Example 1. Calculate Canada’s per capita net worth if Canada’s net worth is $5, 702 billion and the population is 33 million Solution: 5 702 000 000 000 ÷ 33 000 000 = $172 787.88
Percent Change • Measures a change in a value over time Percent change = (new value – old value) ÷ (old value) X 100% Example 2: A company’s profit in 2009 was $186000. In 2010 it was $325000. Calculate the percent change Percent change = (325000-186000) ÷186000 X 100 = 74.7%
Percentile • A number (between 1 and 99) that represents the percent of the population with a score equal to or less than this number Example 3: The following were scores on a recent math quiz (out of 20): 5, 8, 9, 11, 11, 11, 13, 14, 16, 17, 18, 19
Percentile • What percentile is a score of 13? Solution: 7/12 =0.583 = 59% (always round up) Therefore a score of 13 would be in the 59th percentile. (59% would have a score of 13 or less)
Percentile Rank • Percentile Rank is the percent of the population with a score less than a value p is the percentile rank L is the number less than a score n is the total number of scores
Percentile Rank Example 4. Calculate the percentile rank for a score of 14 using the values from example 4: 5, 8, 9, 11, 11, 11, 13, 14, 16, 17, 18, 19 Solution: A score of 14 has a percentile rank of 63%, or a score of 14 is in the 63rd percentile.
Weighted Mean • The weighted mean is an average of each score multiplied by its weighting Example 5. A student scored 95% on his chapter 1 quiz (worth 5%), 65% on his chapter 1 test (worth 10%) and 75% on his chapter 1 project (worth 8%). Calculate his weighted average.
Weighted Mean Solution:
Practice • Page 205 #1, 2, 3, 4