Central Tendency and Variability: Understanding Scores and The Normal Curve
This quick review provides an overview of central tendency measures—mean, median, and mode—and the characteristics of distributions, including normal and skewed shapes. It discusses how to evaluate scores with raw scores and z-scores, illustrating the significance of z-transformation for comparing different variables. Additionally, it covers theoretical probability distributions (Z, F, T) for hypothesis testing and understanding experimental outcomes. Key aspects of the standard normal curve, including critical values and probability ranges, are highlighted for practical application.

Central Tendency and Variability: Understanding Scores and The Normal Curve
E N D
Presentation Transcript
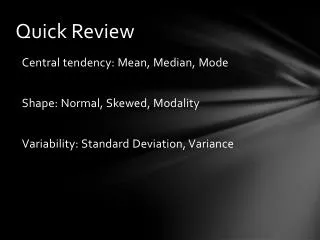
Quick Review • Central tendency: Mean, Median, Mode • Shape: Normal, Skewed, Modality • Variability: Standard Deviation, Variance
Evaluating scores • Raw score of X: • -Measure of absolute standing • Difficult to interpret • Z-SCORE • - Measure of relative standing
Z-Transformation • Transforming all raw scores in a distribution does not change the shape of a distribution, it does change the mean and the standard deviation
Z Transformation • Z transformation provides a common metric to compare scores on different variables • Given X , find Z • Given Z , find X
-THEORETICAL PROBABILITY DISTRIBUTIONS (Z, F, T) -Used for testing hypothesis -Provide a way of determining probability of an obtained sample result (experimental outcome) -Usually, the probably that experimental result occurred by chance given null distribution
A THEORETICAL PROBABILITY DISTRIBUTION The standard normal curve: - Bell-Shaped, symmetrical, asymptotic - Mean, Median and Mode all equal - Mean = 0; SD (δ) = 1; Variance (δ2) = 1
Area under curve probability Z is continuous so one can only compute probability for a range of values THE NORMAL CURVE
BASIC RULES TO REMEMBER: THE (STANDARD) NORMAL CURVE
BASIC RULES TO REMEMBER: 50% above Z=0, 50% below Z = 0 34% between Z=0 & Z= 1 / between Z=0 & Z = -1 68% between Z = -1 and Z = +1 96% between Z = -2 and Z = +2 99% between Z = -3 and Z = +3 THE (STANDARD) NORMAL CURVE
TWO-TAILED CRITICAL VALUES 5% + and -1.96 1% + and – 2.58 THE (STANDARD) NORMAL CURVE
ONE-TAILED CRITICAL VALUES 5% + OR - 1.645 1% + OR – 2.33 THE NORMAL CURVE