Data Distribution Project
This project presents a comprehensive analysis of spending data from boys and girls in school and on weekends. It includes a stem-and-leaf plot and box-and-whisker comparisons which highlight differences in expenditures. Data indicate that boys generally spend more than girls during both school days and weekends, with weekends showing higher spending overall. The analysis also reveals that lunch costs more on weekends. The visual representations make it easy to interpret spending patterns among students, demonstrating the trend of weekend expenditures being notably higher.


Data Distribution Project
E N D
Presentation Transcript
Data Distribution Project Laurent Melo 2np period
GIRL’S DATA SCHOOL Maria $.00 Ann $ .00 Fatima $.00 Lisa $5.00 Melody $.40 Taylor $ .40 Nancy $4.00 Susy $ .80 Ellen $1.75 Jen $1.75 Elena $2.00 Laura $2.00 Sara $ .40 Stacy $5.00 Lina $ .40 Herlinda $ .40 DayDay $1.75 Von $ .40 Lucy $ .00 Catherine $ .40
Girl’s Data Weekend Maria $20.00 Ann $10.00 Fatima $15.00 Lisa $ 7.00 Melody $ .00 Taylor $15.00 Nancy $20.00 Susy $ 5.00 Ellen $ 5.00 Jen $ 5.00 Elena $10.00 Laura $10.00 Sara $ 5.00 Stacy $20.00 Lina $ 5.00 Herlinda $ 5.00 DayDay $ 3.00 Von $10.00 Lucy $10 .00 Catherine $ 7.00
BOYS DATA SCHOOL Brian $3.00 Luis $ .40 Omar $1.50 Miguel $ .40 Will $2.50 Alend $1.75 Robert $ .40 Ahmed $3.00 Alex $ .80 Hussein $1.75 Roberto $1.75 Marcos $ .00 Rafael $1.75 Jairo $ .00 Jose $1.50 Marc $ .75 Fernando $4.00 John $1.00 Edgar $2.50 Cristian $1.50
Boy’s Data Weekend Brian $20.00 Luis $15.00 Omar $10.00 Miguel $20.00 Will $20.00 Alend $10.00 Robert $15.00 Ahmed $ 5.00 Alex $ 9.00 Hussein $20.00 Roberto $ 6.00 Marcos $20.00 Rafael $ 5.00 Jairo $10.00 Jose $ 3.00 Marc $ 7.50 Fernando $10.00 John $15.00 Edgar $ 7.00 Cristian $10.00
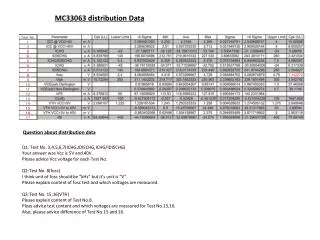
Five Number Summary • Mix x =0 • Q1= .9 • Med =4 • Q3=10 • Max X=20 Frequency=5
Outliers IQR Q3-Q1 10-.9= 9.1 Q1) .9-(1.5*9.1) =-12.75 Q3)10+(1.5*9.1) =23.7 There are no outliers
FEMALES • Mix X=0 • Q1=.4 • Med=4.5 • Q3=8.5 • Max X=20 Frequency=5
MALES • Mix X=0 • Q1=1.5 • Med=3.5 • Q3=10 • Max X=20 Frequency=5
SCHOOL • Mix X=0 • Q1=.4 • Med=1.25 • Q3=1.87 • Max X=5
WEEKEND • Mix X=0 • Q1=5 • Med=10 • Q3=15 • Max X=20 Frequency=5
How the stem-and-leaf plot and box-and-whiskers compare?? • Stem-and leaf and the box of whisker are both compare by being the easier plots to understand. • It is easy to see how much money it is spend during the school days and weekends. • The majority of the boys spent more money than the girls spent in both school and weekend.
Where does the lunch cost more? • Lunch cost more on the weekend than during the week. • Because Most of the students spend more money on the weekends than during the week.
Clearer Picture • For me the stem-leaf plot is easier to understand than the box-and-whiskers plot. It is easy to see how much was spent, and who spent more.