Imaging
Imaging . Medical imaging is an important diagnostic tool It involves: Image acquisition Image reconstruction Image Processing Image Analysis Image Interpretation. Image formation. Physical properties are different, but fundamentally a 3 D object is being imaged:


Imaging
E N D
Presentation Transcript
Imaging • Medical imaging is an important diagnostic tool • It involves: • Image acquisition • Image reconstruction • Image Processing • Image Analysis • Image Interpretation
Image formation • Physical properties are different, but fundamentally a 3 D object is being imaged: • let a tissue have a distribution of some property f = q (x,y,z) • Then the image g = T(f), where T is the transformation describing the imaging process. • Depending on the imaging modality, the distribution f only reflects one property of the object, ie linear attenuation or water content, not the real object. • The aim is to define some characteristics of the object using a specific T, and perhaps combine many T’s (multi-modality imaging)
Where do we see images • Film • Monitors Display Issues • Film properties: When images are transferred to film, the final product is affected- permanently • Monitors: Several parameters govern the visualization
RADIOGRAPHS AND COMPUTED TOMOGRAPHY (CT) • Based on attenuation of x-rays. • Denser the tissue > attenuation (atomic number) • Muscle, soft tissue very similar Io I = Io e -µz z For multiple thicknesses with different attenuation: I = Io e -(µ1z1)e -(µ2z2)e -(µ3z3) P(x,y) = Ln I / Io (x,y)= Integral µ (x,y,z) Projection theorem
Radiographic Image of 3D Structure SI AP ML SI ML AP
Examples of Radiographic Images of Trabecular Bone Pattern Anterior-Posterior Coronal Medial Lateral Sagittal Superior-Inferior Axial Femur Sample: Density = 107.6 mg/cm3
Examples of Radiographic Images of Trabecular Bone Pattern Anterior-Posterior Coronal Medial Lateral Sagittal Superior-Inferior Axial Spine Sample: Density = 59.9 mg/cm3
RADIONUCLIDE IMAGING • Single Positron Emission Tomography: (SPECT) • Positron emission tomography (PET) • Images gamma emitters, nuclides administered to subject • Resolution governed by detectors, signal to noise, etc.
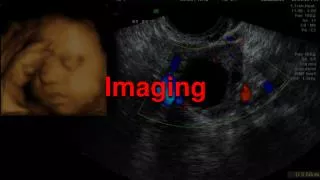
ULTRASOUND • Measures sound attributes: Acoustic Impedence = rc c =speed of sound) • Attenuation : Ioe-µz • Doppler shift measures moving objects such as blood. Ifr f is frequency of the US wave, then Df = -2vfcosq, v is velocity, q angle of incidence • For vessels: Flow volume = v Area of cross-section.
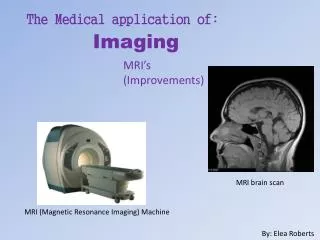
MAGNETIC RESONANCE • Water content • Biochemistry • Flow • Diffusion • Metabolic Activity
OPTICAL MICROSCOPY • Impact on light
ELECTRO-MAGNETIC TOMOGRAPHY • Electro-Magnetic Tomography (EMT) from EEG or MEG: • data (electric potentials in EEG or biomagnetic fields in MEG + time) produced through an evoked potential experiment or an EEG-MEG monitoring are first acquired through a multichannel recorder (one channel per electrode/coil). • Accounting for the 3D location of every electrode/coil, the current density distribution inside the brain can be reconstructed in 4D space and time) by trying to assess the biological generators from the measurements. • Inverse problem there is no way at this time to take accurately into account every single piece of the puzzle which affects the path between biological generators and physical measurements.
ELECTRIC POTENTIAL TOMOGRAPHY:EPILEPSY MAXIMUM CURRENT DENSITY
ELECTRIC POTENTIAL TOMOGRAPHY:EPILEPSY VECTOR CURRENT DENSITY
Linearity of Imaging systems • Ag = AT(f) = T(Af) Scaling the object property leads to scaling the image identically • If Bg= BT(g) = T(Bg) then • Ag+Bg = AT(f) + BT(g) = T(Af) + T(Bg) • This is linearity, is often assumed, but films sturate and have a curve associated and are non-linear.
Linearity of Imaging systems • Radionuclide imaging examines concentrations and maps directly -- this is closest to being linear • Xray attenuation: higher the atomic number, greater the attenuation, so it should be linear, but properties of xray attenuation (wavelength dependent) change as the tissue atomic number changes. • MR: Higher the water content the brighter the signal, yes unless the magnetic field changes due to local changes….
Point Spread Function • All imaging systems produce a degradation of the image • T(f) is not a delta function, it produces a blurring. • The blurring effect is defined by the Point Spread Function, Point Response Function (PSF, PRF). • PSF depends on the imaging system, and noise.
Properties of the Point Spread Function • Point Sensitivity: Is the total signal obtained from a point object the same in space? • Spatial Linearity: Are all points depicted identically with respect to shape and geometry? If one knows the point spread function, and the system is position independent the system can be characterized.