Download
1 / 30
300 likes | 514 Vues
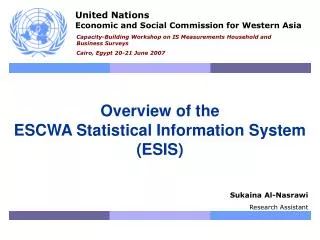
United Nations Economic and Social Commission for Western Asia. Overview of the ESCWA Statistical Information System (ESIS). Capacity-Building Workshop on IS Measurements Household and Business Surveys Cairo, Egypt 20-21 June 2007. Sukaina Al-Nasrawi Research Assistant. Outline.

E N D
United Nations Economic and Social Commission for Western Asia Overview of theESCWA Statistical Information System (ESIS) Capacity-Building Workshop on IS Measurements Household and Business Surveys Cairo, Egypt 20-21 June 2007 Sukaina Al-Nasrawi Research Assistant
Outline • Introduction • ESIS Requirements • ESIS Design • ESIS Deployment / Progress Made • ESIS Development Tools • ESIS Simulation Example • Future ESIS Plan
Introduction • Originally based on a prototype database system for ICT indicators, ESIS was developed, deployed and tested during 2004-2005. • It was mainly aimed at providing the substantive divisions within the regional Economic and Social Commission for Western Asia (ESCWA), with a tool to: • Systematically store and retrieve indicators, • Monitor data pertaining to various social and economic development sectors, • Integrate cumulative statistics from all sectors, and • Provide policies and decision makers from the ESCWA region with a reliable platform for analysis, evaluation and comparisons.
Introduction: Current Status / Architecture • Currently there exist desktop and web interfaces for ESIS. • Desktop interface: • Makes it possible for users to create new indicators, update values and undertake various necessary functions. • Includes a bilingual tabular and graphical reporting mechanism that facilitates data interpretation and manipulation. • Web interface: • Gives decision-makers across the region and the world access to ESIS content • Increases services to member countries by making indicators and relevant data more readily available to policymakers and interested parties across the region.
Outline • Introduction • ESIS Requirements • ESIS Design • ESIS Deployment / Progress Made • ESIS Development Tools • ESIS Simulation Example • Future ESIS Plan
ESIS Requirements Database Server: - Windows 2000 server or Advanced server - SQL Server 2000 Enterprise Edition Web Server: - Windows 2000 Server or Advanced Server with Service Pack 2 - MDAC 2.7 for Data (Microsoft Data Access Components) - Internet Information Services (IIS) - .NET Framework ESIS Requirements Client Side Server Side Intel Personal Computer: - Windows 2000 or Windows XP - Microsoft office 2000 or XP (English and Arabic) - LAN connection to the database server
Outline • Introduction • ESIS Requirements • ESIS Design • ESIS Deployment / Progress Made • ESIS Development Tools • ESIS Simulation Example • Future ESIS Plan
Times T3 T2 T1 C1 C2 C3 D1 Countries/regions I1 D1(I1,C2,T1) I2 I3 Indicators ESIS Design : Main Dimensions • Main dimensions of ESIS comprise a 3D space whereby the three axes represent: • Time • Country or Region (group of countries), • Indicators • A data point in this space represents the intersection of the values on the three axes
Departments Databaseowner Users Databaseadministration Data Administrators Indicators Countries/Regions Time Data entry Computation Transfer Forecast ESIS ESIS Design: Users Guests Data Managers Reports
ESIS Design: Input Modules • Data can be stored / updated in the DB by: • Direct Manual entry • Automatic transfer from Excel spreadsheets • Computation is done: • Individually i.e., on the cell level by selecting 1 indicator and 1 year in the specified form) • In mass by selecting 1 or more country/ region, 1 or more indicator and 1 or more year. Basic System Details: while storing/ computing data, the system addresses the two main concerns of statistical information systems: Data integrationandData harmonization
ESIS Design: Output Modules • The reporting function enables users to display standard or dynamic reports. • Standard reports: Predefined and preformatted for quick view or display of the information. They: • Enable users to retrieve quickly a profile or a complete set of indicators for a specified country or region. • Provide users with the option of making a ranking of countries within a region for a specified indicator. • Dynamic reports: Allow the users to identify their own selection of countries or regions, indicators and years then produce the desired table or a chart in Excel.
ESIS Design: Organization of Indicators • Indicators are statistical entities conceived to assess the development of an economic or a social sector through time and space. • In ESIS, the “indicators” entity sometimes refers to primary or raw statistics, while at other times it refers to indicators or statistics derived from others. • For this reason, the set of indicators is divided into the following two sub-sets: • Primary indicators: raw statistics or statistics that are not associated to a formula; • Derived indicators: statistics that are the result of a computation of other statistics.
Mi ESIS Design: Organization of Indicators • Indicators are grouped into Modules. • Module: an organized set of indicators/statistics related to a specific sector and targeting the same theme (e.g. 'Energy resources and use' module). • Category: a sub-grouping of a module • Sub-Category: a sub-grouping of a category • Indicator: a statistical entity that could be primary or derived. Derived indicators can include in their formula indicators from different categories and modules, as well as other derived indicators (Inx ). Indicators’ Properties: Definition Type (number, text) Unit Regional (average, total) Proportional (directly, inversely) Default decimal places Default scaling
ESIS Design: Organization of Indicators • Indicators could be allocated to Collections. • Collection is an organized set of indicators/statistics not necessarily related to a specific economic or social sector. The indicators are not unique in the set of collections (e.g. MDI Collection) • Sub1-collection: is a sub-grouping of a collection (e.g. Goal 8 is a sub1-collection of the 'MDI' collection). • Sub2-collection: is a sub-grouping of a sub1-collection (e.g. 'Target 12', 'Target 13'... sub2-collections of the 'Goal 8' sub1-collection) • Indicator: in a collection can be related to different modules or sectors, and is not unique in the set of collections
ESIS Design: Organization of Countries/Regions • Countries and Regions in ESIS constitute one mixed entity. For this reason, regions are treated like standalone countries. In some cases, and where the countries belonging to a region exist in the database, a grouping of countries can be done. • A region can exist as an independent item (Rc), or as a group of countries (Ra). A country can be included in one or more than one region (C4), or exists as an independent item (C3). Properties of the Countries/Regions: A region and a country are similar A region is a group of countries linked either geographically or economically Aggregations are possible
ESIS Design: Wrap Up • Common tools for data entry, reporting and analysis • Common interface leading to a consistent look • Web based with secure access control • Single repository of customized and comparable data across different sectors • Flexible, definable and modifiable data structure • Bilingual (English and Arabic)
Outline • Introduction • ESIS Requirements • ESIS Design • ESIS Deployment / Progress Made • ESIS Development Tools • ESIS Simulation Example • Future ESIS Plan
ESIS Deployment: Progress made at Training Level • ESIS was presented in many workshops and meetings in the region. • The Participants indicated that: • ESIS could serve as part of an overall regional capacity-building strategy aimed at assisting member countries in collecting, manipulating and disseminating statistical indicators and corresponding information. • Representatives of national statistical offices in the ESCWA member countries expressed interest in using ESIS. • Several entities such as the UAE Federal National Council (UAE FNC), the Gulf Organization for Industrial Consulting (GOIC) and the Ministry of Telecommunication in Syria expressed their need for such a system and willingness to adopt ESIS in their respective institutions. • Despite the growing interest of several countries to adopt ESIS as a tool to build their capacities in indicators management, • many are still either not exposed to the software • or do not know its real benefits.
Outline • Introduction • ESIS Requirements • ESIS Design • ESIS Deployment / Progress Made • ESIS Development Tools • ESIS Simulation Example • Future ESIS Plan
Public Internal users Read Read ESIS db Write ESIS Development Tools • The ESIS database is developed using Microsoft SQL server • The desktop interface is developed using Microsoft Visual Basic 6.0 • The web component is developed using the .Net framework, in particular ASP.net
Outline • Introduction • ESIS Requirements • ESIS Design • ESIS Deployment / Progress Made • ESIS Development Tools • ESIS Simulation Example • Future ESIS Plan
P1 P2 P3 P4 ESIS Simulation Example : Web Component Information and Communication Technology ESCWA Statistical Information System Region / Country Statistics / Indicators
P5 P6 P7 P8 ESIS Simulation Example : Web Component Years Data Information Export to Excel Report Created
ESIS Simulation Example : Desktop component ESIS Desktop Component Demo
S2 S1 S3 S4 ESIS Simulation Example : Desktop Component Reports Countries/ Regions Customize
S5 S6 S7 S8 ESIS Simulation Example : Desktop Component Time Selected Items Results Preview Report Created
Outline • Introduction • ESIS Requirements • ESIS Design • ESIS Deployment / Progress Made • ESIS Development Tools • ESIS Simulation Example • Future ESIS Plan
Future ESIS Plan • Make ESIS a Packaged Software Solution to: • Promote its use by making it a stand-alone, free of charge packaged software. • Offer member countries a tool to assist them in handling their statistical indicators, monitoring regional and international indicators, thereby building their capacities in indicators’ management, data collection and analysis, as well as to facilitate data exchange between EMCs and ESCWA. • The project would consist of 5 phases that are: • Software development phase • Documentation phase • Packaging phase • Promotion phase • Support phase