Labour Force
Labour Force. Trends. Labour force It’s labour supply Remember supply schedule - it will change with the exogenous variables LF = Employed + Unemployed = E + U It’s those who can be useful/used Not in labour force. Statistics Canada => the Labour Force Survey (LFS ) Monthly


Labour Force
E N D
Presentation Transcript
Labour Force Trends
Labour force • It’s labour supply • Remember supply schedule - it will change with the exogenous variables • LF = Employed + Unemployed = E + U • It’s those who can be useful/used • Not in labour force
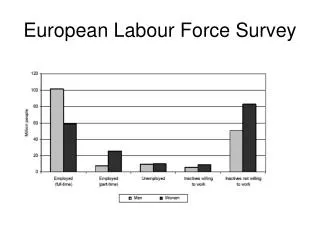
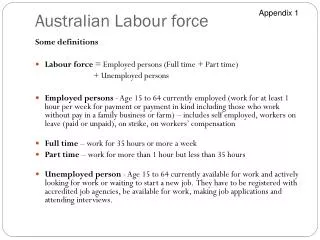
Statistics Canada => the Labour Force Survey (LFS) • Monthly • in a reference week • Employed: worked for pay or profit at least one hour in the reference week • “normally working,” but didn’t work in reference week • Illness • Holidays • Strike • Unemployed: • Didn’t work in the reference week + available to work + searched for work in the 4 previous weeks • Didn’t work in the reference week + will start work in next 4 weeks • temporary layoff • about to start new job • Not in the LF: everyone else • Retirees • fulltime students • Homemakers • Slackers
Labour force grows • 1947: 4.9 million • 1998: 15.6 million • 2003: 17.0 million • 2010: 18.7 million • 2031: 20.5-22.5 million • faster in the 1960s-1970s (3%/year) • slower afterwards (1%/year in 1990s, 2%/year 1999-2003) • Slower yet in 2010s-2020s
LABOUR FORCE entries withdrawals labour force participation rate • 14 yo and under • Armed Forces • Institutuionalized • Living on reserves • Living in the territories civilian working age population domestic population emigration new humans (fertility rate) dead humans (mortality rate) new immigrants
Population Base Growth • 1960: 18 million • 1970: 21 million • 1980: 25 million • 1990: 28 million • 2000: 31 million • 2010: 34 million • 2012: 35 million • Where from?
Fertility rate • 1960: 3.8 • 1970: 2.3 • 1980: 1.7, and stays about there • It is below replacement rate 2.1 • Why? • Busier • Costly • Birth rate • Older (baby boomers)
Mortality rate • No significant changes in last 30 years • Death rate • Declining birth rate + constant death rate = … • Declining natural (population) growth rate
More population growth: • Immigration • Emigration • Net immigration > 0 in Canada • Immigration rates • A bit above 1% (of Canada’s population) in 1950s • About 0.75% now • Close to 200,000/year
Kinds of immigrants: • Country quotas up to 1968 (race) • Point system from 1968 • Skill • Experience • Family • Classes • Independent • Family • Business • Refugees • Came from Europe, now come from Asia • More family now, too • How would you expect them to do when they come
Kinds of immigrants: • Country quotas up to 1968 (race) • Point system from 1968 • Skill • Experience • Family • Classes • Independent • Family • Business • Refugees • Came from Europe, now come from Asia • More family now, too • How would you expect them to do when they come
Labour force participation: • Labour force participation rate • = (labour force / working age population) x 100% • Overall increase • 1947: 55% • 2012: 67% • Too general: Men vs women • Youth: • Cyclical participation
What’s up with the women? • Social attitudes • War and 60s • Educational levels • More flexible-hour jobs • Service sector up • Employment opportunities • Urbanization • Legislation • Women’s wages up • Fertility down • Washers/dryers/microwaves • Living standards, helpless men, and two-earner family • Marriage break-ups up • Have to work • Have to insure
What’s up with the women? • Social attitudes • War and 60s • Educational levels • More flexible-hour jobs • Service sector up • Employment opportunities • Urbanization • Legislation • Women’s wages up • Fertility down • Washers/dryers/microwaves • Living standards, helpless men, and two-earner family • Marriage break-ups up • Have to work • Have to insure