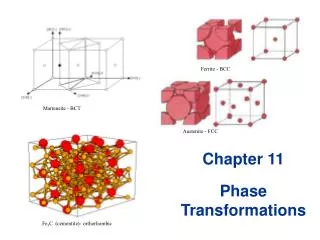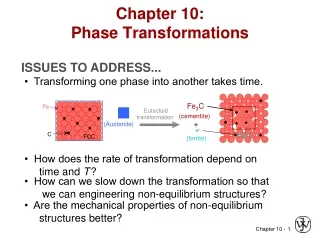
Phase Transformations
Phase Transformations. Kinetics. Why study Phase Transformation ( in Metal). Development of a set of desirable mechanical properties results from a phase transformation → heat treatment.

Phase Transformations
E N D
Presentation Transcript
Phase Transformations Kinetics EBB512 –Phase Equilibria and Phase Diagrams
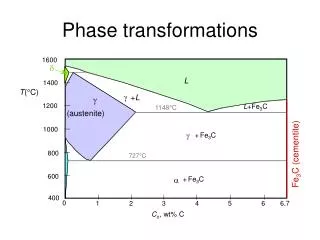
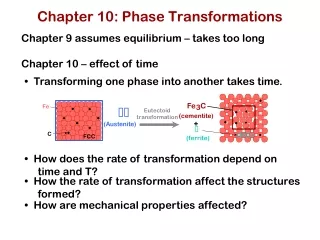
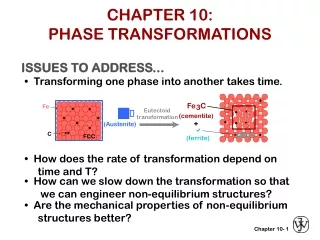
Why study Phase Transformation ( in Metal) Development of a set of desirable mechanical properties results from a phase transformation → heat treatment Time- Temperature dependencies of some phase transformation are conveniently represented on a modified phase diagrams EBB512 –Phase Equilibria and Phase Diagrams
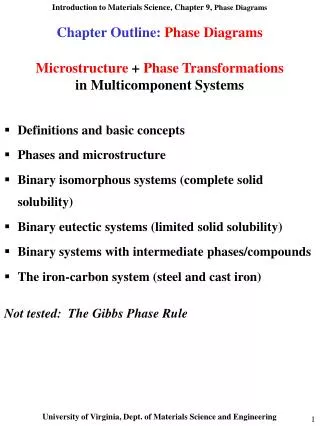
It is important to know how to use the diagram in order to design heat treatment that will yield room temperature mechanical properties Eg. Tensile strength of an iron-carbide alloy of eutectoid composition (0.76%C) can be varied bet.~700MPa to 2000MPa depending on heat treatment employed EBB512 –Phase Equilibria and Phase Diagrams
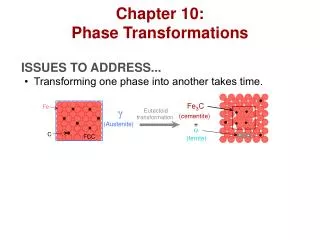
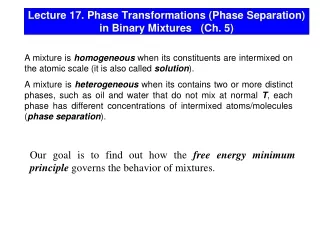
Phase transformations (change of the microstructure) can be divided into three categories: • Diffusion-dependent with no change in phase composition or number of phases present • Diffusion-dependent with changes in phase composition and/or number of phases (eg. Eutectoid transformations) • Diffusionless phase transformation – produces a metastable phase by cooperative small displacement of atoms in structure. EBB512 –Phase Equilibria and Phase Diagrams
Phase transformations do not occur instantaneously • Diffusion-dependent phase transformations can be rather slow and the final structure often depend on the rate of cooling/heating. • Hence need to consider the kinetics of the phase transformation EBB512 –Phase Equilibria and Phase Diagrams
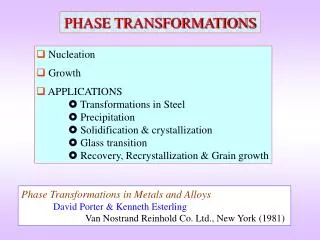
Kinetics of Phase Transformations Most phase transformations involve change in composition >> redistribution of atoms via diffusion is required. The process involves : Nucleation of new phase –formation of stable small particles (nuclei) of new phase. Nuclei are often formed at grain boundaries and other defects. Growth of new phase EBB512 –Phase Equilibria and Phase Diagrams
Plot of fraction reacted versus the logarithmic of time typical of many solid-state transformation in which temperature is held constant. f = fraction transformation t= time k and n is a time-dependent constants for particular reaction. f = 1 – exp(-ktn) ……….Avrami equation EBB512 –Phase Equilibria and Phase Diagrams
Precipitation of a single-phase solid- nucleation Precipitation within a homogeneous liquid matrix – homogeneousnucleation The more common case is precipitation occuring at some structural imperfection such as foreign surface- heterogeneous nucleation EBB512 –Phase Equilibria and Phase Diagrams
For solid –state trnasformations displaying kinetic behavior shown in Fig. fraction transformation y is afunction time t as follows: Y = 1 – exp(-ktn) …. Eqn 8.1 Avrami Equation k and n (0.5 -5)are time-dependent constants for a particular rxn. By convention rate of transformation r is taken as the reciprocal of time required for the transformation to proceed halfway to completion, t0.5 EBB512 –Phase Equilibria and Phase Diagrams
r = 1/t0.5 …………..eqn 8.2 rate increases with temp. according to Arrhenius eqn, characteristic for thermally activated process EBB512 –Phase Equilibria and Phase Diagrams
per atom per mole rate increases with temp. according to Arrhenius eqn, characteristic for thermally activated process r= Aexp(-Q/kT) = A exp(-Q/RT) ………… 8.3 EBB512 –Phase Equilibria and Phase Diagrams
Superheating and supercooling • Upon crossing a phase boundary on the composition-temperature phase diagram phase transformation towards equilibrium state is induced • But the transition to the equilibrium structure takes time and transformation is delayed. • During cooling, transformation occur at temperatures less than predicted by phase diagram: supercooling • During heating, transformation occur at temperatures greater than predicted by phase diagram: superheating EBB512 –Phase Equilibria and Phase Diagrams
Degree of supercooling/super heating increases with rate of cooling/heating • Meta stable states can be formed as a result of fast temperature change. Microstructure is strongly affected by cooling rate • We will consider the effect of time on phase transformation using iron-carbon alloy as an example EBB512 –Phase Equilibria and Phase Diagrams
The S-shaped curves are shifted to a longer times at higher T indicating transformation is dominated by nucleation and not by diffusion EBB512 –Phase Equilibria and Phase Diagrams
(Referring to earlier diagram) • Euctectoid temp. indicated by the horizontal line →austenite is stable for all times • The austenite to pearlite transformation will only occur if alloy supercooled to below the eutectoid temp. • The required will depend on the temp. • From eqn 8.2 transformation rate at some particular temp inversely propnl. To the time required for rxn proceed 50% completion. • Eg. Temp just below eutectoid 105 s , while at 540oC ~ 3 s EBB512 –Phase Equilibria and Phase Diagrams
This rate –temp behavior contradict eqn 8.3 → rate increases with increasing temperature EBB512 –Phase Equilibria and Phase Diagrams
The above Fig. is isothermal transformation diagram or commonly known as TTT diagram – temperature,time, and transformation. EBB512 –Phase Equilibria and Phase Diagrams
This Fig shows the progress of transformation that can be traceby a group of curves showing different percentages of completion • Using the industrially important eutectoid transformation in steels as an eg. • 2 types of transformation: 1. Diffusional transformation in solid – eutectoid transformation 2. Diffusionless (martensitic) transformations EBB512 –Phase Equilibria and Phase Diagrams
1. Diffusional transformation in solid – eutectoid transformation • Involve a change of structure due to the long range migration of atoms • Fig 8-7 shows TTT diagram of eutectoid stell (Fe with 0.77 wt%C EBB512 –Phase Equilibria and Phase Diagrams
Fig 8-7 EBB512 –Phase Equilibria and Phase Diagrams
The most important new info provided in Fig 8-7 –pearlite is not the only microstructure that can develop from cooling of austenite • For certain temp. bainite rather than pearlite is formed • Base p.d eutecticand eutectoid structures are generally fine - grained • But for slow cooling near the eutectoid temp-coarse pearlite EBB512 –Phase Equilibria and Phase Diagrams
Reason: low nucleation rates and high diffusion rates near eutectoid temp lead to relatively coarse structure Fine pearlite formed at low temperature bcos transformation is diffusion control. EBB512 –Phase Equilibria and Phase Diagrams
Bainite Formation • Pearlite formation – from eutectoid temp (727oC) down to about 400oC • Below 400oC, ferrite and cementite form as extremely fine needles in microstructure known as bainite • Eventhough various morphologies develop over the range of temperatures- all have the same phase composition and relative amount of each phase. EBB512 –Phase Equilibria and Phase Diagrams
A slow cooling path that leads to coarse pearlite formation is superimposed on the TTT diagram for eutectoid steel. This type of thermal history was assumed,in general, throughout previous lectures EBB512 –Phase Equilibria and Phase Diagrams
The microstructure of bainite involves extremely fine needles of -Fe and Fe3C, in contrast to the lamellar structure of pearlite. (From Metals Handbook,8th Ed., Vol. 7: Atlas of Microstructures, American Society for Metals, Metals Park, Ohio, 1972.) EBB512 –Phase Equilibria and Phase Diagrams
The interpretation of TTT diagrams requires consideration of the thermal history ìpath.î For example, coarse pearlite, once formed, remains stable upon cooling. The finer-grain structures are less stable because of the energy associated with the grain boundary area. (By contrast, phase diagrams represent equilibrium and identify stable phases independent of the path used to reach a given state point.) EBB512 –Phase Equilibria and Phase Diagrams
2. Diffusionless (martensitic) transformations Fig 8-11 EBB512 –Phase Equilibria and Phase Diagrams
Diffusionless (martensitic) transformations • Fig 8-11 shows ver different process occur at lower temp. – below 250oC • Two horizontal lines are added mto represent the occurrence of a diffusionless process known as martensitic transformation • This is a generic term referring to a broad family of diffusionless transformation in metals an non-metals alike. • Common eg. trsnfmtn in eutectoid steel – product from the quenched austenite – martensite EBB512 –Phase Equilibria and Phase Diagrams
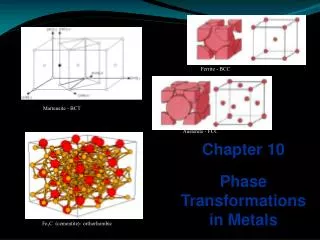
Quenching austenite rapidly enough bypassing the pearlite knee (~550oC) – suppress diffusional transformation • The austenite increasingly become unstable with decreasing • At about 215oC the austenite transform spontaneously to martensite (~1% of the austenite) • Instead of diffusional migration of C to form α and Fe3C , there is sudden reorientation of C and Fe from fcc SS of γ-Fe to bct SS – which is martensite EBB512 –Phase Equilibria and Phase Diagrams
In (a),the bct unit cell is shown relative to the fcc lattice by the h100i axes. In (b), the bct unit cell is shown before (left) and after (right) the transformation. The open circles represent iron atoms. The solid circle represents an interstitially dissolved carbon atom. EBB512 –Phase Equilibria and Phase Diagrams
Complex crystal structure,and supersaturated conc. Of carbon atoms in martensite lead to a characteristically brittle nature • The start of martensitic transformation - line Ms • If quenching below this line austenite increasingly become unstable and more will transfrom to martensite. • Various stages of martensitic transformation in Fig 8-11 • - 46oC transformation complete. EBB512 –Phase Equilibria and Phase Diagrams
The End EBB512 –Phase Equilibria and Phase Diagrams