Download
1 / 32
320 likes | 544 Vues
THE HYDROGEOLOGY OF MOAB-SPANISH VALLEY, SOUTHEASTERN UTAH, WITH EMPHASIS ON MAPS FOR WATER-RESOURCE MANAGEMENT AND LAND-USE PLANNING. by Mike Lowe, Janae Wallace, and Stefan Kirby Utah Geological Survey and Charles Bishop 2007. Funding provided by: Utah Division of Water Rights

E N D
THE HYDROGEOLOGY OF MOAB-SPANISH VALLEY, SOUTHEASTERN UTAH, WITH EMPHASIS ON MAPS FOR WATER-RESOURCE MANAGEMENT AND LAND-USE PLANNING by Mike Lowe, Janae Wallace, and Stefan Kirby Utah Geological Survey and Charles Bishop 2007 • Funding provided by: • Utah Division of Water Rights • U.S. Environmental Protection Agency • Grand County • Utah School and Institutional Trust Lands Administration • Utah Geological Survey Funded by: U.S. PA through Utah Division of Water Quality http://geology.utah.gov/online/ss/ss-120/ss-120.pdf
BACKGROUND • Moab-Spanish Valley is a semi-rural area in Grand and San Juan Counties that is experiencing an increase in residential development • Development in Grand County is on a community sewer system, but development in San Juan County uses septic-tank systems • Nitrate contamination in the valley-fill aquifer is a potential threat • Water-resource managers need a better understanding of ground-water conditions to better appropriate and manage water rights • Local government officials desire land-use management tools to help preserve water quality
PURPOSE • Characterize the relationship of geology to ground-water conditions in the Glen Canyon and unconsolidated valley-fill aquifers • Map ground-water recharge and discharge areas for the valley-fill aquifer – vulnerability to surface sources of pollution • Classify the ground-water quality of the Glen Canyon (east of valley only) and valley-fill aquifers – baseline water quality/beneficial uses • Using a ground-water flow model to apply a mass-balance approach, provide septic-tank density/lot-size recommendations to protect water quality
RELATION OF GEOLOGY TO GROUND_WATER CONDITIONS SW NE Spanish Valley Purpose • Glen Canyon geometry and extent • Fault and fracture characteristics of Glen Canyon aquifer relating to ground-water occurrence and movement • Valley-fill aquifer geometry and sediment types • Geologic framework data to be used to construct new ground-water flow model, which includes Glen Canyon aquifer, and assist with resource management • Salt Tectonics • Major faults and folds • Uplift and erosion • Dissolution and collapse • Valley fill deposition After Doelling (1988)
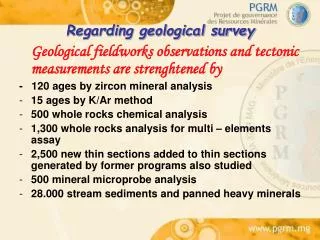
Hydrostratigraphy Scan-line Survey • Glen Canyon Group (Lower Jurassic)-dual permeablity aquifer • Wingate Sandstone, Kayenta Formation, and Navajo Sandstone • Mostly eolian sandstones, some fluvial (Kayenta) • Navajo rock properties • Unfractured K = 0.004 to 5 ft/day (Hood and Patterson, 1984; Freethey and Cordy, 1991) • Fractured K up to 88 ft/day (Freethey and Cordy, 1991) • Thickness (Doelling, 2001, 2004) • Jn up to 800 ft • Jk 100–300 ft • Jw 250-450 ft • Total Jgc ~ 1200 ft
Glen Canyon Aquifer • Outcrop extent • Recharge from the La Sals (Sumsion, 1971; Blanchard, 1990) • Major local recharge from Mill Creek and Pack Creek (Sumsion, 1971; Blanchard, 1990) • This type of map helps to map lineaments
GEOLOGY • Valley margin faults, due to gouge, may act as barriers to flow perpendicular to valley • There are two structural ground-water compartments due to offset along the Moab fault
Structure Contour • The Glen Canyon Group ranges in thickness from about 330 feet south and southeast of Moab to about 1300 feet beneath southeastern Moab-Spanish Valley • Glen Canyon Group is absent in the subsurface near Moab
Outcrop Joint Data Lineament Domains • Based on color-Orthophotos • Unimodal orientation • NW trending except in SE • Density variation • Examined at outcrop along NE margin of valley 25 sites, ~1300 joints measured • Principal (NW-striking) and secondary (NE-striking) joint sets • Variety of trace lengths, terminations • Open or partially infilled -calcite most common • Fracture density varies
The valley fill of Moab-Spanish Valley consists mainly of stream, alluvial-fan, mass-movement, and wind-blown deposits, and generally lacks extensive fine-grained layers.
The valley fill is more than 400 feet thick near the Colorado River northwest of Moab. The valley fill thins to about 100 feet over a concealed bedrock high southeast of Moab and then thickens to more than 300 feet beneath southeastern Moab-Spanish Valley. Moab
No GCG • 72 WELLS SAMPLED 1968-2004 • TDS RANGE: 140 – 1818 mg/L; AVERAGE TDS 687 mg/L • NITRATE RANGE: 0.06 – 7.37 mg/L; AVERAGE NITRATE 2.2 mg/L • MOST WELLS NO3 <1 mg/L () • 3 WELLS EXCEEDED PRIMARY WATER QUALITY STANDARD FOR RADIONUCLIDES; 1 SECONDARY FOR IRON; 15 FOR SULFATE
GROUND-WATER QUALITY CLASSIFICATION Sole Source Aquifer designation, 2002 18% PRISTINE 82% DRINKING-WATER QUALITY
MASS-BALANCE APPROACH(Key parameters) • Domain Acreage • Background nitrate concentration • Current number of septic tanks • Ground water available for mixing • Nitrogen loading from septic tanks
SITE SPECIFIC SEPTIC-TANK DENSITY VS. WATER QUALITY DEGRADATION STUDIES (CALCULATIONS) Q=TLI (VOLUME of Discharge= Transmissivity x Length of flow x Hydraulic Gradient) Background N mass + N mass from new septic tanks Volume of discharge through aquifer + Waste-water volume
Two layers (valley fill • and bedrock) • 216 rows, 82 columns • Cell size ranges from 140 x 160 feet to 500 x 500 feet Downs and Kovacs, 2000
1.08 cfs 2.1cfs 2.8 cfs
Nitrogen Loading Septic-tank discharge of 242 gallons/day percapita indoor usage – 70 gallons/day – Utah Division of Water Resources, 2001 San Juan County’s average 3.46 person household – U.S. Census Bureau, 2002 Estimated nitrogen loading of 54.4 mg/L average nitrogen loading – 17 g N per capita per day (Kaplan, 1988) San Juan County’s average 3.46 person household – U.S. Census Bureau, 2002 15 percent retainment of nitrogen in tank (later removed during pumping) (Andreoli and others, 1979)
Parameters used to perform a mass-balance analysis for different ground-water flow domains in Moab-Spanish Valley, Grand and San Juan Counties, Utah. *data were derived using ground-water flow computer model . +septic systems were estimated by the Southeast Utah Health Department (Jim Adamson, 2002, written communication; Lance Christie 2003, verbal communication).
Projected septic-tank density versus nitrate concentration for domain 1 in Moab-Spanish Valley, Grand and San Juan Counties, Utah, based on 74 existing septic tanks
Results of the mass-balance analysis using the best-estimate nitrogen loading of 54 mg N/L* for different ground-water flow domains in Moab-Spanish Valley, Grand and San Juan Counties, Utah. *best-estimate calculation is based on a nitrogen load of 17 g N per capita per day (from Kaplan, 1988) for a 3.46-person household and 242 gallons per capita as the amount of water generated per household based on the 2001 Utah State Water Plan (Utah Division of Water Resources, 2001a). **second number after/ corresponds to the calculated lot-size recommendation based on an allowable degradation of overall nitrate concentration to be 5 and 3 mg/L, respectively, for domains 2 and 3.
Conclusions • Movement of water in the Glen Canyon aquifer controlled by fracture characteristics • Glen Canyon aquifer lies directly beneath valley-fill along much of Spanish Valley, but is absent in subsurface near Moab • Glen Canyon aquifer lineaments (usually joint zones) increase regional permeability parallel to valley axis • Outcrop scale joints more complex, generally increase permeability parallel to valley axis • Valley margin normal faults (where present) may decrease permeability perpendicular to valley axis • The valley-fill generally lacks confining beds, and is mostly primary recharge area; it is considered vulnerable to surface sources of pollution • Overall ground-water quality is good: 18% Pristine; 82% Drinking-water quality • Poorest quality water in valley-fill aquifer is where Glen Canyon Group is absent in subsurface • Based on our ground-water modeling using the mass-balance there are three ground-water flow domains in the valley-fill aquifer; to be protective of ground-water quality lot sizes for development using septic-tank systems should be no smaller than 10 or 20 acres, depending on domain
RECHARGE-acre-ft/yr Estimated: Subsurface inflow-12,300 Infiltration ppt-730 Seepage-Kens Lake- 3300 Total Recharge=17,330 Steady-state calibration: Subsurface inflow-12,765 Infiltration ppt-728 Seepage-Kens Lake- 3157 Total Recharge=16,650 DISCHARGE-acre-ft/yr Estimated: Seepage to streams-1140 Withdrawal wells/springs -6400 Seepage to Colo. Riv. - 9530 Total Discharge=17,330 Steady-state calibration: Seepage to streams-1099 Withdrawal wells/springs - 6398 Seepage to Colo. Riv. - 9153 Total Discharge=16,650 Ground-Water Budget