Download
1 / 27
270 likes | 420 Vues
Age, Size and Growth. ZOO 511 week 3 slides. Metrics of Size and Growth. Length PROS: easy, intuitive, history in angling, length rarely shrinks, nonlethal CONS: lots of change in biomass not related to length Wet Weight (i.e., weighing a live fish)

E N D
Age, Size and Growth ZOO 511 week 3 slides
Metrics of Size and Growth • Length • PROS: easy, intuitive, history in angling, length rarely shrinks, nonlethal • CONS: lots of change in biomass not related to length • Wet Weight (i.e., weighing a live fish) • PROS: nonlethal, quick, useful for large calculations (ie population biomass) • CONS: can be difficult in the field if conditions are bad • Dry Weight (i.e., weighing a dehydrated fish) • PROS: accurate description of individual's mass • CONS: time intensive and lethal to fish
3 ways to estimate growth in natural populations • Recaptures of marked individuals • Length-Frequency Analysis • Back calculation from calcified structures # Caught
Recaptures of marked individuals METHOD: measure individuals and give them unique marks; recapture and measure again later PROS: nonlethal, accurate individual data CONS: high effort - have to catch & mark A LOT of fish
Length-Frequency Analysis METHOD: measure population at least once; plot length vs. frequency to find age classes; compare across age classes to estimate growth Age class 5 Age class 4 Age class 3 Age class 2 Age class 1 # Caught Length (mm)
Length-Frequency Analysis METHOD: measure population at least once; plot length vs. frequency to find age classes; compare across age classes to estimate growth PROS: nonlethal; can use historic data; can do with 1 sample CONS: “snap shot” of growth; assumes constant conditions; easy to bias sample with gear, time or location; requires lots of fish # Caught Length (mm)
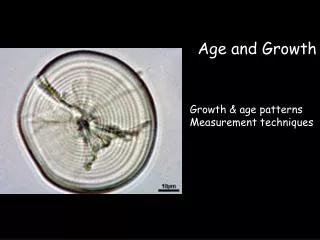
Back Calculation METHOD: Examine hard structures from individuals for age and evidence of past growth rate Periods of rapid and slow growth show up as rings
Back Calculation METHOD: Examine hard structures from individuals for evidence of past growth rate PROS: sometimes nonlethal; accurate individual data; no repeated sampling; does not assume constant conditions; can used archived structures; can estimate over small size/time changes; CONS: sometimes lethal; can be technically challenging
Hard structures to estimate age & growth Vertebrae (sharks) Cleithra (pikes & relatives) Fin Rays Opercula
Hard structures to estimate age & growth Otoliths (lethal) Scales (non-lethal)
Otoliths work the same way Plus they are useful for many other things But you have to kill the fish to retrieve them And they are more work to process
Otoliths • What is an otolith? • Where exactly is an otolith?
section & polish analyze harvest
Otoliths and fishery science • Unique properties: • Otolith growth is continual • Lack of resorption • Complete growth and environmental record • Crystalline structure • Holds trace metals • Scientists use otolith composition to: • Estimate what temperatures the fish experienced in the past • Determine where the fish traveled (e.g., ocean vs. freshwater)
Frasier-Lee Equation Lt= c + (LT – c)(St/ST) L means fish length S means scale radius little t means some time in the past big T means now
Frasier-Lee Equation Lt= c + (LT – c)(St/ST) c is “Carlander’s constant” -- it will have a different value for different species
Now we have a lot of length-at-age points. How do we summarize growth patterns from this?
How do we compare growth between 2 populations? Insert real data here?
Von Bertalanffy Growth Model Lt = L∞ - (L∞ - L0) –kt • Lt = length at time “t” (of an avg. fish in the population) • L∞ = length at infinity • L0 = length at time zero (birth) • K = constant (shape of growth line)
Von Bertalanffy Growth Model Lt = L∞ - (L∞ - L0) –kt If you give the model this It will give you these
Lt = L∞ - (L∞ - L0)-kt WS AL