Download
1 / 30
460 likes | 907 Vues
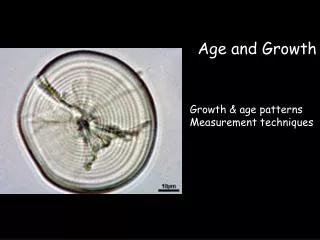
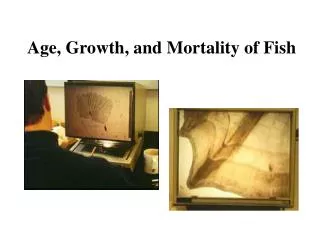
Age and Growth of Fish. Definitions and metrics Three primary ways to estimate growth. Age and Growth of Fish. Age refers to years Aging fish, all fish have a birthday on January 1 - Change with spawning time (spring or fall in WI) Age class is the year the fish is born

E N D
Age and Growth of Fish • Definitions and metrics • Three primary ways to estimate growth
Age and Growth of Fish • Age refers to years • Aging fish, all fish have a birthday on January 1 • - Change with spawning time (spring or fall in WI) • Age class is the year the fish is born • Not that all that interesting in itself, used to describe growth • - Exceptions might be maturity • 2. Growth is the change in length, wet weight, or dry weight over time • Why so many metrics?
Different metrics of fish growth Length -Pros: easy, intuitive, history in angling, length rarely shrinks -Cons: lots of change in biomass not related in length Wet Weight -Pros: used in large calculations (ie population biomass), metric used in production -Cons: can take more time in field (rocking boat or wind and balance don't mix) Dry Weight – fat weighs less then water but is way more valuable to individual. 24-72 hours at 60 degrees C (140° F) -Pros: accurate description of individual's current state -Cons: time intensive and must kill fish
How the metrics are related • Length Frequency Analysis W= 3.3287*L-12.689 W=.000004*L3.2603 W= 2.8401*L - 10.662
3 ways to estimate growth in natural populations • Length Frequency Analysis • Recaptures of individually marked fish • Back calculation from calcified structures # Caught
Length Frequency Analysis Pros: non-destructive, archived lengths Cons: have to catch lots of fish, unknowns are high!, easy to bias sample with gear, time, or location
Recaptures of marked individuals Pros: non-destructive, good individual data Cons: have to catch TONS of fish to see a recapture You Come back a year later.... Population is 10000 fish ...at best maybe 60 survived.... You catch and tag 100 fish, good effort, but ...maybe only 10% lost their tags .... so there are 54 tags in 10,000 fish
Estimating growth from tagging Pros: understand the variability in individual growth Cons: tag loss, tagging may influence growth, behavior, or mortality, cant read tag www.dfg.ca.gov/.../FishTagDescriptions.htm www.dfg.ca.gov/.../FishTagDescriptions.htm www.daybreakfishing.com/TaggingFish.html www.dfg.ca.gov/.../FishTagDescriptions.htm
T-bar, dart, floy tags –old school www.fishinginpuertorico.com/page_ds10.htm
Coded Wire Tags – new school http://www.hafro.is/catag/myndir/cwt.jpg
PIT Tags – newest school passive integrated transponder www.bnl.gov/.../Herpetological_Inventories.htm www.absc.usgs.gov/.../coho_archivetags_obj2.htm www.hpl.umces.edu/facilities/fishhatchery4.htm
Tags for small fish Visible Implant Elastomer – new school
Interpreting age from structures • WE INTERPRET • we don't age, we don't assign ages • - seems overdone, but it is important, because it teaches you that you may be wrong, which is ok, as long as you know you might be wrong! • Cause Brian learned "the art" from Dr. John Casselman (OMNR) 2 main uses: Age and Back Calculate
Age Age = this 358 mm largemouth bass is 10 years old 10 9 8 7 6 5 4 3 2 1
Processed 76 largemouth bass Crampton Lake (border upper penn. and WI)
Back Calculate Growth 10 7 3
RADIUS 0.09 0.29 0.4 0.51 0.59 0.67 0.72 0.83 0.88 0.92 0.95 LENGTH 0 89 143 197 284 300 310 330 338 345 355 GROWTH (mm) 89 54 54 87 16 10 20 8 7 10 0 Back Calculation Age = this 358 mm largemouth bass is 10 years old AGE 0 1 2 3 4 5 6 7 8 9 10 YEAR 1995 1996 1997 1998 1999 2000 2001 2002 2003 2004 2005
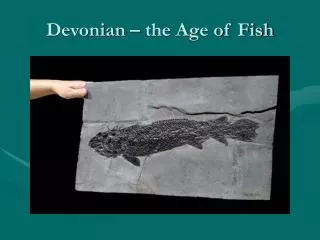
Other structures used for aging Cleithra - Esocidae (sacrifice) http://www.palaeos.com/Vertebrates/Bones/Dermal/Opercular.html Opercula (sacrifice) arvidsfishingreport.com/
Other structures used for aging Fin Rays – anything where scales don't work and you don't want to kill the fish Vertebrae-Sharks (no spines, teeny otoliths) www.fws.gov/midwest/alpena/rpt-stnib02.htm www.pac.dfo-mpo.gc.ca/.../lingcod/ling_aging.htm
How we look at growth data ...ie figures! Size at age How do we quantify how these populations are different?
Lt = *(1 – e(-K*t)) L∞ Von Bertalanffy Growth Equation Lt = length at time 't' L∞= maximum length
Problems with back calculation • Lee's Phenomenon LENGTH AT AGE
Which fish have been taken out already Which fish are not represented?
Fisheries Uses of Age and Growth • What does the age structure look like Walleye population in Lake Nevafishd Maturity Walleye population in Takemal Flowage Maturity
Fisheries Uses of Age and Growth • What if the length limit on bluegill was 150mm
RADIUS 0.09 0.29 0.4 0.51 0.59 0.67 0.72 0.83 0.88 0.92 0.95 LENGTH 0 89 143 197 284 300 310 330 338 345 355 GROWTH (mm) 89 54 54 87 16 10 20 8 7 10 0 Ecology of growth AGE 0 1 2 3 4 5 6 7 8 9 10 YEAR 1995 1996 1997 1998 1999 2000 2001 2002 2003 2004 2005
What ecological factors might influence that growth Water temperature Age Climate or the Year Food availability Number of competitors