Download
1 / 18
180 likes | 197 Vues
Study analyzing CFD simulation uncertainties in transonic flow, observing sources and magnitudes to enhance result accuracy and inform users.

E N D
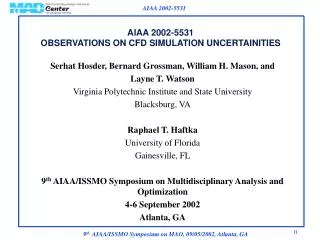
AIAA 2002-5531OBSERVATIONS ON CFD SIMULATION UNCERTAINTIES Serhat Hosder, Bernard Grossman, William H. Mason, and Layne T. Watson Virginia Polytechnic Institute and State University Blacksburg, VA Raphael T. Haftka University of Florida Gainesville, FL 9th AIAA/ISSMO Symposium on Multidisciplinary Analysis and Optimization 4-6 September 2002 Atlanta, GA
Introduction • Computational fluid dynamics (CFD) as an aero/hydrodynamic analysis and design tool • CFD being used increasingly in multidisciplinary design and optimization (MDO) problems • Different levels of fidelity • from linear potential solvers to RANS codes • CFD results have an associated uncertainty, originating from different sources • Sources and magnitudes of the uncertainty important to assess the accuracy of the results
Drag polar results from 1st AIAA Drag Prediction Workshop (Hemsch, 2001)
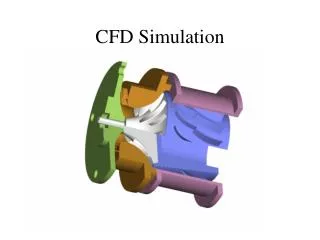
Objective of the Paper • Finding the magnitude of CFD simulation uncertainties that a well informed user may encounter and analyzing their sources • We study 2-D, turbulent, transonic flow in a converging-diverging channel • complex fluid dynamics problem • affordable for making multiple runs
Transonic Diffuser Problem Weak shock case (Pe/P0i=0.82) Pe/P0i experiment CFD Strong shock case (Pe/P0i=0.72) Pe/P0i streamlines Separation bubble Contour variable: velocity magnitude
Uncertainty Sources (following Oberkampf and Blottner) • Physical Modeling Uncertainty • PDEs describing the flow • Euler, Thin-Layer N-S, Full N-S, etc. • boundary conditions and initial conditions • geometry representation • auxiliary physical models • turbulence models, thermodynamic models, etc. • Discretization Error • Iterative Convergence Error • Programming Errors We show that uncertainties from different sources interact
Computational Modeling • General Aerodynamic Simulation Program (GASP) • A commercial, Reynolds-averaged, 3-D, finite volume Navier-Stokes (N-S) code • Has different solution and modeling options. An informed CFD user still “uncertain” about which one to choose • For inviscid fluxes (most commonly used options in CFD) • Upwind-biased 3rd order accurate Roe-Flux scheme • Flux-limiters: Min-Mod and Van Albada • Turbulence models (typical for turbulent flows) • Spalart-Allmaras (Sp-Al) • k- (Wilcox, 1998 version) with Sarkar’s compressibility correction
Grids Used in the Computations Grid 2 y/ht A single solution on grid 5 requires approximately 1170 hours of total node CPU time on a SGI Origin2000 with six processors (10000 cycles) Grid 2 is the typical grid level used in CFD applications
Nozzle efficiency Nozzle efficiency (neff ), a global indicator of CFD results: H0i : Total enthalpy at the inlet He : Enthalpy at the exit Hes : Exit enthalpy at the state that would be reached by isentropic expansion to the actual pressure at the exit
Uncertainty in Nozzle Efficiency Strong Shock Weak Shock Maximum value of
Discretization Error by Richardson’s Extrapolation error coefficient order of the method a measure of grid spacing grid level
Major Observations on the Discretization Errors • Grid convergence is not achieved with grid levels that have moderate mesh sizes. For the strong shock case, even with the finest mesh level we can afford, asymptotic convergence is not certain • As a consequence of above result, it is difficult to separate physical modeling uncertainties from numerical errors • Shock-induced flow separation, thus the flow structure, has a significant effect on grid convergence • Discretization error magnitudes are different for different turbulence models. The magnitudes of numerical errors are affected by the physical models chosen.
Error in Geometry Representation Upstream of the shock, discrepancy between the CFD results of original geometry and the experiment is due to the error in geometry representation. Downstream of the shock, wall pressure distributions are the same regardless of the geometry used.
Downstream Boundary Condition Extending the geometry or changing the exit pressure ratio affect: • location and strength of the shock • size of the separation bubble
Conclusions • Based on the results obtained from this study, • For attached flows without shocks (or with weak shocks), informed users may obtain reasonably accurate results • They may get large errors for the cases with strong shocks and substantial separation • Grid convergence is not achieved with grid levels that have moderate mesh sizes (especially for separated flows) • The flow structure has a significant effect on the grid convergence • It is difficult to isolate physical modeling uncertainties from numerical errors
Conclusions • Uncertainties from different sources interact, especially in the simulation of flows with separation • The magnitudes of numerical errors are influenced by the physical models (turbulence models) used • In nozzle efficiency results, • range of variation for the strong shock is much larger than the one observed in the weak shock case (10% vs. 4%) • the error between grid level 2 and grid level 4 can be up to 6% (strong shock) • relative uncertainty due to the selection of the turbulence model can be as large as 9% (strong shock)