Download
1 / 56
630 likes | 1.78k Vues
Mass Filters in Mass Spectrometry. Separations of ions based on properties of mass and charge. All experiments have this basic backbone, but range of applications implies a diversity of experimental approaches. Mass Spec is “A Universal Technique”. Analysis by MS does not require:

E N D
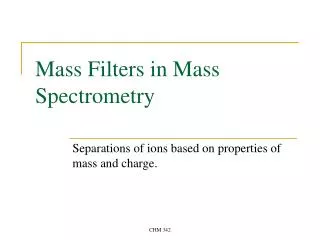
Mass Filters in Mass Spectrometry Separations of ions based on properties of mass and charge. CHM 342
All experiments have this basic backbone, but range of applications implies a diversity of experimental approaches. Mass Spec is “A Universal Technique” • Analysis by MS does not require: • Chemical modification of the analyte • Any unique or specific chemical properties • In theory, MS is capable of measuring any gas-phase molecule that carries a charge • Analyzed molecules range in size from H+ to mega-Dalton DNA and intact viruses • As a result, the technique has found widespread use • Organic, Elemental, Environmental, Forensic, Biological, Reaction dynamics CHM 342
What does the mass filter do? • A mass spectrometer determines the mass-to-charge ratio (m/z) of gas-phase ions by subjecting them to known electric or magnetic fields and analyzing their resultant motion. • Sectors – magnetic or electric • Quadrupole • Ion Trap • Time of flight (TOF) • Ion Cyclotron Resonance (FT-MS) • Tandem system (MS-MS, MS-MS-MS, etc) CHM 342
Vacuum Requirement • Mean Free Path: the average distance a molecule travels between collisions. • For typical MS conditions, can be estimated as: • L in cm, p in mTorr • Suggests pressures on the order of 10-5 torr to move a molecule across a meter without collision. • Requires moderately sophisticated, and moderately expensive systems of vacuum pumps CHM 342
Vacuum Systems • All mass spectrometers operate at very low pressure (high vacuum) to reduce the chance of ions colliding with other molecules in the mass analyzer • collisions cause the ions to react, neutralize, scatter, or fragment. • these processes will interfere with the mass spectrum • Experiments are conducted under high vacuum conditions (10-2 to 10-5 Pa or 10-4 to 10-7 torr) • Requires two pumping stages: • mechanical pump - provides rough vacuum ~0.1 Pa (10-3 torr) • second stage uses diffusion pumps or turbomolecular pumps to provide high vacuum • ICR instruments have even higher vacuum requirements (often includes a cryogenic pump for a third pumping stage) CHM 342
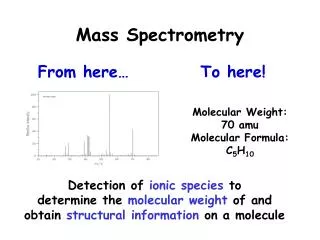
The Mass Spectrum • A mass spectrum is a plot of signal intensity vs. m/z • To compare different MS techniques we need to provide numerical indications of how good the data is . . . CHM 342
Information from a Mass Spectrum • Identification of molecular mass • Determination of structure • Determination of elemental composition • Determination of isotopic composition • Quantification • Not inherent – requires consideration of ionization efficiencies, ion transmission, detector response … • Qualitative information is much easier to extract! CHM 342
m/z • The mass-to-charge ratio is often referred to as m/z and is typically considered to be unitless: • m: mass number = atomic mass in u • with 1 u = 1/NA g • z: charge number = Q in e • with 1 e = 1.6022×10⁻¹⁹ C • the Thompson has been proposed as a unit for m/z, but is only sometimes used • Historically, most ions in MS had z = 1 • with new ionization techniques, this is no longer true CHM 342
Signal Intensity • Depending on the type of mass spectrometer, ions may be detected by direct impact with a detector or by monitoring of an induced current image. • Recorded signal can be measured in: • Counts per unit time (Digital) • Voltage per unit time (Analog) • Power (Frequency domain) • To a first approximation, relative signal intensity reflects relative ion abundance CHM 342
Figures of Merit for the Mass Spec • Selection of appropriate MS instrumentation and conditions depends on analysis sought and key figures of merit. Sensitivity Ion Transmission Duty Cycle m/z Range Mass Resolving Power Mass Accuracy CHM 342
Resolving Power • Mass peak width ( Dm 50%) • Full width of mass spectral peak at half-maximum peak height • Mass resolution / Resolving Power (m / Dm 50%) • Quantifies ability to isolated single mass spectral peak • Mass accuracy • Mass accuracy is the ability to measure or calibrate the instrument response against a known entity. Difference between measured and actual mass CHM 342
“The history of spectroscopy is the history of resolution …”- A. G. Marshall, et al, A. Chem., 74(9), 252A, 2002. • Different charge but the same mass • Differing in nominal closest-integer mass • Ions of the same chemical formula but different isotopic composition • Ions of the same nominal mass but different elemental composition • Note m/z dependence of necessary resolving power CHM 342
Mass Accuracy • Mass accuracy is linked to resolution. • A low resolution instrument cannot provide a high mass accuracy • High resolution and high mass accuracy enables determination of elemental composition based on exact mass • Possible because of elements’ mass defects • Requirements increase as m/z increases Exact masses and corresponding formula for various ions of m/z 180 containing only C, H, N, and O atoms. CHM 342
Different types of mass filters CHM 342
Time-of-Flight MS • To determine m/z values • A packet of ions is accelerated by a • known potential and the flight times • of the ions are measured over a • known distance. • Key Performance Notes • Based on dispersion in time • Measures all m/z simultaneously, • implying potentially high duty cycle • “Unlimited” mass range • DC electric fields • Small footprint • Relatively inexpensive CHM 342
Time-of-Flight MS CHM 342
Time-of-Flight MS • Ions accelerated by strong field, E, within short source region, S. • Drift times recorded across long, field-free drift region, D • vD depends on starting position of ion – ideally all ions start from same plane. CHM 342
but there are complicating factors . . . • TOF = total recorded flight time of an ion • to = Ion formation time after T0 of TOF measurement • ta = Time in acceleration region, which depends on initial position and initial energy • tD = Time in drift region, which depends on initial position and initial energy • td = Response time of detector • For any m/z in a time-of-flight mass spectrum, the recorded peak will be the sum of signals corresponding to multiple, independent, ion arrival events • Each ion arrival will be recorded at a unique TOF, (see eqn above) CHM 342
Resolution in TOF • TOF’, which is the center of the peak in the mass spectrum, will be an average of all individual ion arrival TOFs • The width of TOF’, Dt, will depend on the distribution of the individual ion arrival TOFs (and other factors …) CHM 342
Improving Resolution in TOF MS At ionization: U = U0(initial ion energy) At exit of extraction: U = U0 + Eextxq At beginning of drift: U = U0 + Eextxq + (V1-V2)q Tune source voltages and/or delay to compensate for DU0 and create space focus at detector. Mass dependent. CHM 342
Improving Resolution in TOF MS - Reflectrons • Reflectron consists of a series of electrodes, forming a linear field in direction opposite of initial acceleration. • Ions are slowed by this field, eventually turning around and accelerating back in direction of detector. • Penetration depth depends on Us, which is function of U0 and acceleration field, E. • Reflectron voltages are tuned to create a space focus at the plane of the detector. CHM 342
Two means to the same end • In Delayed Extraction, we give ions different U to achieve same TOF. • In Reflectron, ions possess different U. We force them to travel different D to achieve same same TOF • In both cases resolution is enhanced! CHM 342
TOF is inherently a pulsed detector • TOFMS is an ideal detector for pulsed ionization methods • If ionization event is synchronized with time zero, high duty cycle is achieve • But not all sources are “pulsed” (ex. Electrospray, or stream ions from EI source, etc.) • Because of pulsing, ions are wasted when TOFMS is applied to a continuous source and . . . . • Increased efficiency comes at the expense of mass range and mass resolution • Still, figures of merit and cost make thetechnique desirable CHM 342
Use “orthogonal” extraction • Ions are extraction in a direction orthogonal to original analyte stream trajectory • Extraction event is still rapid (Dt), but extraction volume is determined by length of gate region. CHM 342
orthogonalTOFMS (oTOFMS) • Able to reduce average initial energy in ToF direction to ~0 (resolution and accuracy) • Independent control of beam energy and drift energy, allows maximum duty cycle. • Want tightly collimated beam in extraction region CHM 342
A review question . . . . • Suppose you are attempting to separate these two compounds by LC-MS. The first compound to appear in your chromatogram has an intense peak at m/z = 344.1421. You know that your mass spectrometer has mass accuracy greater than 7 ppm. • What conclusion can you make? • Compound A is the first to come off of the column • Compound B is the first to come off of the column • You are measuring an average of the two compounds that contains mostly A • Nothing -- You do not have sufficient mass accuracy to determine which compound(s) you are measuring CHM 342
1. Compound A is the first to come off of the column CHM 342
Other detectors . . . • TOFMS • Pulse packet of ions introduced into analyzer • All m/z in packet reach detector (“simultaneous detection”) • m/z determination based on dispersion • Based on static, DC fields • Quadrupole MS • Continuous introduction of ions into analyzer • Transmit only specific m/z value to detector • m/z determination based on band-pass filtering • Based on time-vary, RF fields CHM 342
Quadrupole Geometry / operation • Quadrupole consists of four parallel rods • Typical length might be 10’s of cm • Precise dimensions and spacing • Rods connected diagonally in pairs CHM 342
Quadrupole Geometry / operation • Voltage of all rods have a DC component, U. • All rods have RF component of voltage with MHz frequency = ? /2p and amplitude Vo. • Potentials on the two sets are out of phase . • Quadrupole fields cause no acceleration along z axis. V1 = V3= -Fo = -U – Vocos ? t V2 = V4= Fo = U + Vocos ? t CHM 342
Quadrupole stability diagrams • Stability diagram for fixed Rf frequency, fixed m/z. • An ion will have stable trajectory through quadrupole if x and y are always less than radius of quadrupole. • (Sim A) With no RF and positive U, positive ion is stable along X (repelled to center), attracted to negative Y rod causes instability • (Sim C) RF field has stabilized Y trajectory. • Note that with increased U, need greater Vo to achieve this stability. • (Sim E) Instable along x-axis. • Note that as U increases, lower Vo will induce this instability. CHM 342
Mass Selectivity • Many conditions (U, V, m) fall within stability region – there is more than one way for ion to pass through • For selectivity, must also consider stability of other mass values • Apex of generalized stability diagram is at a = 0.237, q = 0.706 • To select transmit narrow mass window, adjust U and Vo such that a = 0.237, q = 0.706 (e.g., Ion B) • For any value m we find a/q = 2U/Vo • To scan values of m through narrow transmission window, hold other parameters constant and scan U and Vo with constant ratio U/Vo = ½(0.233 / 0.706) CHM 342
Mass Selectivity • For ANY value m a/q = 2U/Vo • For, example: • Reduce U, Hold • Still stable, slope of “scan line” is reduced • What effect does this have on resolution? CHM 342
Mass Scanning • Scan line shows U/Vo = ½(0.233 / 0.706) • Increase in mass requires proportional increases in U and Vo to maintain this ratio and these a and q values. CHM 342
Quadrupole Performance Typical Quadrupoles • Maximum m/z ~ 4,000 • Resolution ~ 3,000 • Quadrupoles are low resolution instruments • Usually operated at ‘Unit Mass Resolution’ • Small, lightweight • Easy to couple with chromatography Rf-Only quadrupoles • Operated with U = 0, quadrupole becomes a broad bandpass filter • Such “rf-only” quads are an important tool for transferring ions between regions of mass spectrometers. • Often denoted with small “q” CHM 342
Collisional Cooling • A common application of rf-only multipoles involves collisional cooling. • In an ESI source, the expansion into vacuum produces a ion beam with broad energy distribution • Ion optics and TOFMS experiments rely on precise control of ion energies • Desire strategies to dampen energy from external processes • Rf-induced trajectory in high pressure region yield collisions, and reduction in energy CHM 342
Collisional Cooling CHM 342
Triple Quadrupole Mass Spectrometer Q1 selects parent; q2 CID fragmentation inside RF-only quad; Q3 fragment analysis; Detector • Fragment Ion Scan: Park Q1 on specific parent m/z; scan Q3 through all fragment m/z to determine make-up of Q1 • Parent Ion Scan: Park Q3 on specific fragment m/z; scan Q1 through all parent m/z to determine source of fragment • Neutral Loss Scan: Scan Q1 and Q3 simultaneously, with constant difference, a, between transmitted m/z values (a = MQ1 – MQ3). Signal recorded if ion of m/z= MQ1 has undergone fragmentation producing a neutral of m = a. CHM 342
Quadrupole Ion Trap • Quadrupole ion storage trap mass spectrometer (QUISTOR) - recently developed • traps and analyzes all the ions produced in the source • the S/N is high. • consists of a doughnut shaped ring electrode and two endcap electrodes • A combination of RF and DC voltages is applied to the electrodes to create a quadrupole electric field (similar to the electric field for quadrupole) • electric field traps ions in a potential energy well • scan the RF and DC fields • the fields are scanned so that ions of increasing m/z value are ejected from the cell and detected • The trap is then refilled with a new batch of ions to acquire the next mass spectrum CHM 342
Quadrupole Ion Trap • Several commercial instruments are available • this analyzer is becoming more popular. • QUISTORs are very sensitive, relatively inexpensive, and scan fast enough for GC/MS experiments • The mass resolution of the ion trap is increased by adding a small amount 0.1 Pa (10-3 torr) of Helium as a bath gas. • Collisions between the analyte ions and the inert bath gas dampen the motion of the ions and increases the trapping efficiency of the analyzer CHM 342
Sector Instruments (Mag or Elec) • Magnetic Sector: the first mass spectrometer, built by J.J. Thompson in 1897, used a magnet to measure the m/z value of an electron • Magnetic sector instruments have evolved from this concept • Sector instruments have higher resolution and greater mass range than quadrupole instruments, but they require larger vacuum pumps and often scan more slowly • The typical mass range is to m/z 5000, but this may be extended to m/z 30,000. • Magnetic sector instruments are often used in series with an electric sector, described below, for high resolution and tandem mass spectrometry experiments. CHM 342
Magnetic Sector explained • Magnetic sector instruments separate ions in a magnetic field according to momentum and charge • Ions are accelerated from the source into the magnetic sector by a 1 to 10 kV electric field • the radius of the arc (r) traveled depends upon the momentum of the ion, the charge of the ion (C) and the magnetic field strength (B). • Ions with greater momentum follow a larger radius • Ion velocity - determined by the acceleration voltage (V) and mass to charge ratio (m/z) • the m/z transmitted for a given radius, magnetic field, and acceleration voltage: CHM 342
Contribution by Electric Sectors • An electric sector consists of two concentric curved plates. • A voltage is applied across these plates • Ion beam bends as it travels through the analyzer • voltage is set so the beam follows the curve of the analyzer • The radius of the ion trajectory (r) depends upon the kinetic energy of the ion (V) and the potential field (E) applied across the plates • an electric sector will not separate ions accelerated to a uniform kinetic energy • radius of the ion beam is independent of the ion's mass to charge ratio • electric sector is not useful as a standalone mass analyzer CHM 342
Electric Sector/Double Focusing Mass Spectrometers • The mass resolution of a magnetic sector is limited by the kinetic energy distribution of the ion beam • kinetic energy distribution results from variations in the acceleration of ions produced at different locations in the source . . . . and • from the initial KE distribution of the molecules • an electric sector significantly improves the resolution of the magnetic sector by reducing the kinetic energy distribution of the ions CHM 342
FT-Ion Cyclotron Resonance MS (FT-ICR MS) • FT-ICR mass spectrometry exploits the cyclotron frequency of the ions in a fixed magnetic field • The ions are trapped in a Penning trap (a device for the storage of charged particles using a constant magnetic field and a constant electric field) where they are excited to a larger cyclotron radius by an oscillating electric field perpendicular to the magnetic field. • The signal is detected as an image current as a function of time. • After a Fourier transform, which converts a time-domain signal (the image currents) to a frequency-domain spectrum (the mass spectrum), we can get a “traditional” mass spectrum CHM 342
The ICR trap explained m/z= B/2pf CHM 342