Download
1 / 13
220 likes | 1.29k Vues
World Food Trade. Kyla Drushka SIO 209 30 September 2008. Who produces/exports food?. Resource-rich large countries: export > import . Populous and resource-poor, politically unstable, or poor countries: import < export. (exports - imports) / (consumption in calories). Source: FAO.

E N D
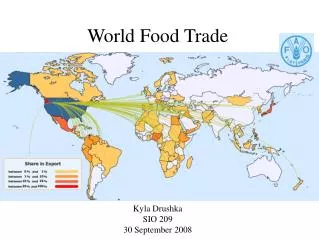
World Food Trade Kyla Drushka SIO 209 30 September 2008
Who produces/exports food? Resource-rich large countries: export > import Populous and resource-poor, politically unstable, or poor countries: import < export (exports - imports)/(consumption in calories) Source: FAO
Oil: for production (fertilizer, machinery), transportation. Supply & demand: some examples: Crop failure :: high prices. Increasing prices :: farmers plant more :: decreased supply of other crops :: increasing prices. Increase in wealth (e.g. China, India) :: increased demand for meat :: increased demand of grains to feed livestock. Ethanol production in the US decreases the supply of maize available as food (“the grain needed to fill up an SUV would feed a person for a year.”) Internationally: Domestic subsidies: stimulate production :: lower international prices; rich vs. poor countries… Tariffs: [rich nations] protect domestic producers. Cheap food since the mid-70s: Obesity, food waste. Farm surpluses dumped on developing countries :: poor farmers driven out of business, decreased priority for domestic agriculture (e.g. in Africa). Recent increase in food prices is likely a trend, not a spike. Food Prices
WTO makes and enforces/regulates trade agreements and rules. 153 members (>95% total world trade). Goal: improve welfare of member countries by lowering trade barriers, and provide a platform for negotiation of trade, and “ensure that trade flows as smoothly, predictably and freely as possible”. Trade rounds: Uruguay round (1986 - 1994) - goals included reducing subsidies. Doha round (2001 - present) - reducing export subsidies, trade-distorting support. Anti-WTO movement: Free trade :: rich get richer, poor get poorer. Large countries dominate, so interests of influential big businesses are met. Free trade may lead to environmental and labor regulations being ignored. Regulation: World Trade Organisation WTO member countries (Source: Wikipedia)
FAO: 850 million undernourished in 1999-2005 (compared to 1 billion obese). Fundamental causes? “Vicious cycle” - hunger/malnutrition :: weakness, inability to learn/work, disease, etc. Poverty, poor distribution. World population too large? Solutions? Food aid vs. education Improved trade conditions Political stability World Bank: best way to break the cycle of poverty/malnutrition is to build export economies, become viable players in the world market. Malnutrition and Hunger Undernourishment (Source: Wikipedia)
International patterns of food trade are extremely complex and volatile Generally speaking, resource-rich, industrialized countries have stronger export economies, and small, populous, resource-poor countries must rely on imports Food prices are fundamentally controlled by supply and demand. However, this is vastly complicated by various domestic and export subsidies, tariffs, an other non-tariff barriers to trade The World Trade Organization is an international organization that negotiates and enforces trade agreements, with the general idea that reducing barriers to international trade (i.e. supporting “free trade”) is beneficial to WTO member nations Although there is enough food produced globally to feed us all, due to factors such as chronic poverty, poor distribution, and high food prices, there are >850 million malnourished people in the world. References FAO Food and Agriculture Atlas Economist 6.12.2007 “Cheap no more” Wikipedia “WTO” Summary
Thoughts on trade subsidies, Causes of world hunger: distribution? Carrying capacity of earth? Should countries be able to grow their own food? discussion
Rice is a staple food for a large part of the world's human population, especially in tropical Latin America, and East, South and Southeast Asia, making it the second-most consumed cereal grain.[3] A traditional food plant in Africa, Rice has the potential to improve nutrition, boost food security, foster rural development and support sustainable landcare.[4] Rice provides more than one fifth of the calories consumed worldwide by humans.[5] In early 2008, some governments and retailers began rationing supplies of the grain due to fears of a global rice shortage.[6][7] World production of rice[44] has risen steadily from about 200 million tonnes of paddy rice in 1960 to 600 million tonnes in 2004. World trade figures are very different, as only about 5–6% of rice produced is traded internationally. The largest three exporting countries are Thailand (26% of world exports), Vietnam (15%), and the United States (11%), while the largest three importers are Indonesia (14%), Bangladesh (4%), and Brazil (3%). Although China and India are the top two largest producers of rice in the world, both of countries consume the majority of the rice produced domestically leaving little to be traded internationally. Between 1961 and 2002, per capita consumption of rice increased by 40%. Rice consumption is highest in Asia, where average per capita consumption is higher than 80 kg/person per year. In the subtropics such as South America, Africa, and the Middle East, per capita consumption averages between 30 and 60 kg/person per year. People in the developed West, including Europe and the United States, consume less than 10 kg/person per year.[49][50] ex: rice
Wheat (Triticum spp.)[1] is a worldwide cultivated grass from the Levant area of the Middle East. Globally, after maize, wheat is the second most produced food among the cereal crops; rice ranks third.[ http://www.fao.org/es/ess/top/commodity.html?lang=en&item=15&year=2005 http://www.nytimes.com/2008/03/09/business/worldbusiness/09crop.html?_r=1&oref=slogin: Many factors are contributing to the rise, but the biggest is runaway demand. In recent years, the world’s developing countries have been growing about 7 percent a year, an unusually rapid rate by historical standards. The high growth rate means hundreds of millions of people are, for the first time, getting access to the basics of life, including a better diet. That jump in demand is helping to drive up the prices of agricultural commodities. Farmers the world over are producing flat-out. American agricultural exports are expected to increase 23 percent this year to $101 billion, a record. The world’s grain stockpiles have fallen to the lowest levels in decades. In seven of the last eight years, world wheat consumption has outpaced production. Stockpiles are at their lowest point in decades. Around the world, wheat is becoming a precious commodity. In Pakistan, thousands of paramilitary troops have been deployed since January to guard trucks carrying wheat and flour. Malaysia, trying to keep its commodities at home, has made it a crime to export flour and other products without a license. As the newly urbanized and newly affluent seek more protein and more calories, a phenomenon called “diet globalization” is playing out around the world. Nigeria grows little wheat, but its people have developed a taste for bread, in part because of marketing by American exporters. Between 1995 and 2005, per capita wheat consumption in Nigeria more than tripled, to 44 pounds a year. Bread has been displacing traditional foods like eba, dumplings made from cassava root. Nigeria’s wheat imports in 2007 were forecast to rise 10 percent more. But demand was also rising in many other places, from Tunisia to Venezuela to India. At the same time, drought and competition from other crops limited supply. So wheat prices soared, and over the last year, bread prices in Nigeria have jumped about 50 percent. ex: wheat
wheat is the second most produced food among the cereal crops; rice ranks third incr demand in developing countries : As the newly urbanized and newly affluent seek more protein and more calories, a phenomenon called “diet globalization” is playing out around the world. Nigeria grows little wheat, but its people have developed a taste for bread In seven of the last eight years, world wheat consumption has outpaced production. Stockpiles are at their lowest point in decades. Around the world, wheat is becoming a precious commodity So wheat prices soared, and over the last year, bread prices in Nigeria have jumped about 50 percent. Example: Wheat
Staple (second-most consumed cereal) , esp. in tropical Latin America and East, South and Southeast Asia provides more than one fifth of the calories consumed worldwide by humans World production of rice[44] has risen steadily from about 200 million tonnes of paddy rice in 1960 to 600 million tonnes in 2004. World trade figures are very different, as only about 5–6% of rice produced is traded internationally. The largest three exporting countries are Thailand (26% of world exports), Vietnam (15%), and the United States (11%), while the largest three importers are Indonesia (14%), Bangladesh (4%), and Brazil (3%). Although China and India are the top two largest producers of rice in the world, both of countries consume the majority of the rice produced domestically leaving little to be traded internationally. Between 1961 and 2002, per capita consumption of rice increased by 40%. Rice consumption is highest in Asia, where average per capita consumption is higher than 80 kg/person per year. In the subtropics such as South America, Africa, and the Middle East, per capita consumption averages between 30 and 60 kg/person per year. People in the developed West, including Europe and the United States, consume less than 10 kg/person per year. Example: Rice