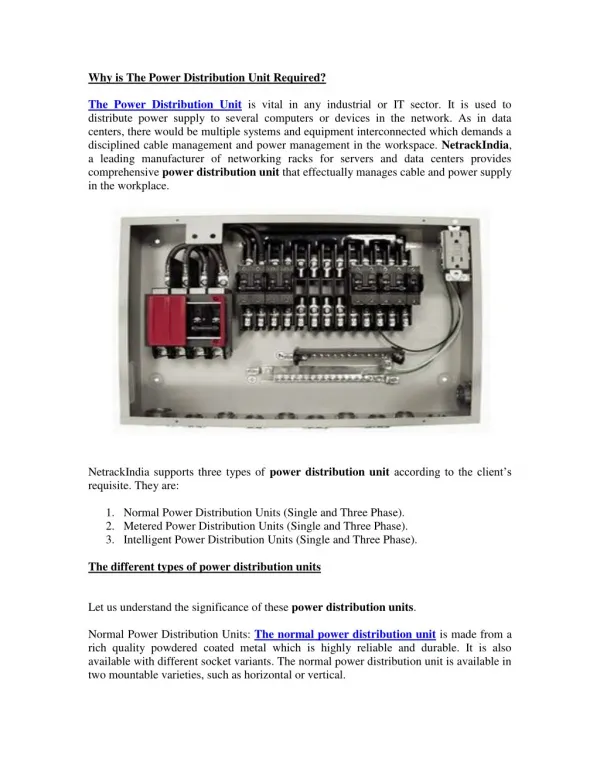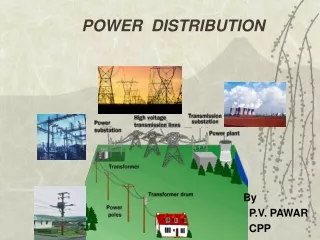
IT in Power Distribution
IT in Power Distribution. ENGINEERING STAFF COLLEGE OF INDIA An Autonomous Organ of the Institution of Engineers (India). NEED OF THE HOUR. Distribution system forms the ultimate link in the power system between the utility and end user. Customer expectations also have gone up to provide

IT in Power Distribution
E N D
Presentation Transcript
IT in Power Distribution ENGINEERING STAFF COLLEGE OF INDIA An Autonomous Organ of the Institution of Engineers (India)
NEED OF THE HOUR • Distribution system forms the ultimate link in the power system between the utility and end user. Customer expectations also have gone up to provide Reliable and quality power Timely redressal of complaints Accurate metering and billing without errors Facility & Flexibility of payment of bills from home
NEED OF THE HOUR Many more in the wish list This can be only possible if the human element at work is replaced to a good extent by automating the operations and use of Information technology becomes indispensable at this juncture
NEED OF THE HOUR • What do we need to do to meet the expectations • Replace still old, conventional, manual systems being continued in most of discoms • With the growth of network and the number of customers adopt newer technologies that provide faster service
NEED OF THE HOUR • Where human intervention is unable to cope up, adopt automation using the available & powerful IT tools • The end result should be that customers are to be provided service levels like in other sectors like banking, communications etc. • All these would improve the image of the utility
AREAS OF FOCUS The focus areas of IT applications are • Quality and reliability of supply • Accurate of billing • Easy payment mechanisms • Better complaints handling IT is used in energy audit, Estimation of baseline losses & Substation /Distribution automation
IT INITIATIVES Aims at • Improvement of efficiency by way of elimination of delays, duplication, drudgery in paperwork • Reduction in overall expenditure. • Provides quick and efficient information systems like on line billing, collection and on line report generation.. • Very fast reconciliation between important activities of metering, billing and collection. • Web based servicing. • To attain transparency and gain credibility. • Customer satisfaction.
IT IMPLEMENTATION INITIATIVES New Trends • Automated Meter Reading • Web Based Servicing • Trouble Call Management System • SCADA • Consumer Analysis Tool (CAT)
IT IN SYSTEM PLANNING IT in System Planning • Load forecast is an important parameter for system planning • Requires accurate data of the system like energy consumption for last 10 years, maximum demand • Methods of load forecast • Trends: The trends for the growth in energy and consumption are computed based on the past data are • To forecast the future demand / energy
IT IN SYSTEM PLANNING • Econometric Approach: Focuses on identification of correlation between demand and variables such as growth in GDP, population and households in the forecast • End-use Approach: Focuses on uses of electricity, takes into account specific consumption of major appliances, degree of saturation of each appliance per customer, number of customer Using the load forecast developed using appropriate models, appropriate system planning package is to be selected for running the load flows
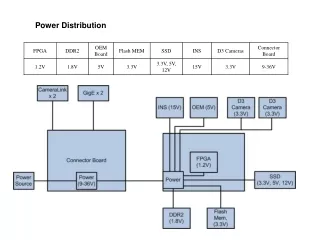
IT IN SYSTEM OPERATION SCADA: Supervisory Control And Data Acquisition It is a system that enables an electric utility to remotely monitor, coordinate and operate distribution components in a real time from remote location.
IT IN SYSTEM OPERATION The basic components of SCADA system are • Control center • Controlled plant • Communication system • SCADA platform uses a master slave communication principle and controls the remote end equipment through Remote Terminal Unit
IT IN SYSTEM OPERATION • RTU can perform several functions like data acquisition, switching of circuit breakers / capacitors, changing of taps etc. based on the commands received from the control centre.
IT IN SYSTEM OPERATION • In the later versions of SCADA, RTUs are being replaced with IEDs (Intelligent Electronic Devices), which have the capability of measuring, monitoring, control, protection and communicating to the local operator or to the remote host (Ex: Numerical Relays)
IT IN SYSTEM OPERATION We can build a Distribution Automation system using the SCADA kernel which can accomplish many functions such as: • Substation Automation • Feeder monitoring and control • Load Management • Automated Meter reading • Trouble call management • Load Survey & Energy audit and so on
IT IN SYSTEM OPERATION Feeder Monitoring and Control • Trippings and breakdowns in general and in rural areas in particular is a matter of serious concern which causes prolonged interruptions and consumer unrest and the same can be addressed through feeder monitoring • Automation of the feeder control can be taken up using Auto reclosures near the breakers and sectionalisers in the line
IT IN SYSTEM OPERATION Feeder Monitoring and Control • For any transient fault in the line, the auto reclosure first trips and then closes after a set time • Sectionalisers help us in isolating the fault during permanent faults and the supply can be restored for the rest of the line
IT IN SYSTEM OPERATION Operation of SCADA requires a good Communication system for which the options available are • Public switched telephone networks • Power line carrier communication • Radio frequency (RF) point-to point/ point-to-multipoint communications
IT IN SYSTEM OPERATION • Optical fibers • VSAT • Ethernet Choose a judicious system considering the functionality and costs
IT in Metering System • Metering technologies have evolved over a period of time starting from electromechanical meters to static meters and later on to the smart meters • The capabilities of meters range from simple recording of energy to communication of recorded energy to either a data collecting device or a billing computer through an appropriate communication system. • Smart meters not only record energy, display the price signals given by the utility but can also run the appliances in the home as per the programme given by the user to optimise the costs.
Static (Electronic) Energy Meters • The static energy meters are micro processor based. The programmability of micro processor is useful to incorporate different features like tamper data, import-export, time-of day metering, load pattern analysis, remote meter reading. • Tamper Data: Data pertaining to tamper such as missing potential, CT polarity reversal, phase sequence reversal can be detected.
Static Energy Meters (cont.) • Time of day metering: The meters have built in real time clock to record energy usage for different times of the day in different registers in the meter. • Day is divided into different time zones, the duration of each time zone is programmable and the user can define their time zones as per their requirement. The meter records the energy consumed in each of the time zones separately and exhibits accordingly. For all HT &EHT consumers in TN & Kerala this is done.
Static Energy Meters (cont.) • Load Survey Data :The meter has the provision to store the billing and tamper data for 35 days at specified logging interval. This is useful to draw the load curves of KWH, KVAH, KVA, which gives the load pattern of the consumer • Import-export Metering: The meter can measure the energy in both directions.
MRI (Meter Reading Instrument) • MRI: This is used for data transfer from/to meter to/from the system, for analysis of data and billing. The MRI can be preloaded with meter numbers to be read and optionally the MRI can also have a bar code reader, which will be useful to identify the s.no. of the meter. In case of HT services with load survey data, MRI is very essential for transfer of data from meter to computer MRI can also be used for LT energy meters.
Printer also can be attached and a bill can be generated immediately upon reading the meter. MRI shall contain the meter sno. And the previous reading. The entire data can be off loaded at the end of the day MRI (Meter Reading Instrument)
Telemetering • Transfer of metered data through a communi-cation network is necessary, to have constant monitoring • The meter shall be connected to a telephone line at the consumer end via a modem. • At the system end also the computer is connected to the telephone via a modem. • Whenever data is to be accessed by the computer. the consumer telephone number to be dialed and the modem connected to the telephone will connect to the meter .
Remote Metering • All 11 kv feeders with predominantly agl. Loads, major industrial loads and selected high value consumers are equipped with data loggers, which store data, which can be retrieved locally through CMRI . • They have communication port RS232 and are read remotely through dial up modems • This helps in conducting load survey, avoid overloading of conductors and also in reduction of losses. • Cases of tampered meters or meters not recording properly and cases of pilferage can be detected.
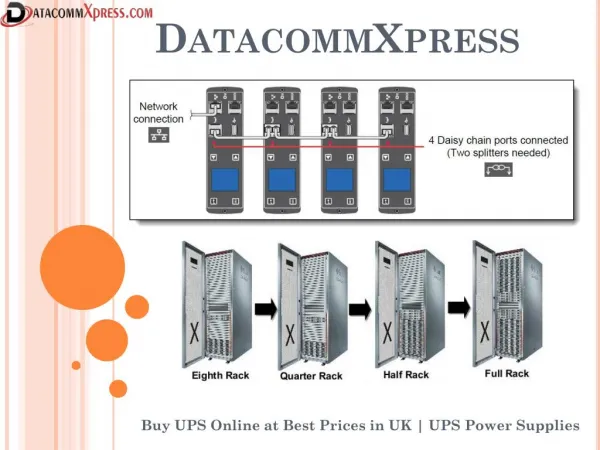
Host PC at Meter Reading Station with compatible software Media Interface device (Out station) Data Communication Media PSTN / GSM Media Interface Device (In station) Electronic Energy Meter Automatic Meter Reading Automatic Meter Reading is a technique to transfer the Meter data / information to a remote location via suitable communication media and necessary hardware set up. AMR uses various Communication technologies as PSTN / GSM
What is AMI • AMI stands for Advanced metering Infrastructure where not only the meter is read but many other functions such as consumer demand management is also done using suitable controller through secure and suitable two way communication
SMART METERS • Smart meter is an advanced electrical metering device that records electricity consumption at regular defined intervals, communicates with utility servers on a real time basis, provides remote connect and disconnect facilities and captures significant events ie., power outage notification, demand side management and power quality monitoring • Smart meters can also run the smart appliances as per the preset programme
SMART METERS • Smart meters are equipped with AMI features like LAN, HAN, automatic switching, demand response as well as theft monitoring and control. • The most important features of a smart meter is a 2 way interface between the meter and utility. • This ensures the continuous monitoring and gives alerts in case the meter is subjected to any tampering
AMI Process Meter communicates with Meter Data Management System ( MDMS) on one side and the Home Area Network (HAN) Meter compliant to AMI ( Smart meter) Meter Data Management System Home Area network Zig bee communication
IT to Reduce AT&C Losses • IT is an important tool to analyze the total input into the system by collecting the meter reading data from all the boundary metering points • The billed units and billed demand are collected from the server. The collected amounts are also gathered from the server. • The difference of the collected amount against the billing demand represents the AT&C losses
DETERMINATION OF TECHNICAL LOSSES ON THE 11 KV FEEDER Technical losses on the 11 kV feeder are assessed by conducting load flow analysis of the individual 11 kV feeders including distribution transformer and LT distribution losses. Steady state model of the network is used to find technical losses
DETERMINATION OF TECHNICAL LOSSES ON THE 11 KV FEEDER The loads are considered to be of constant impedance. Load Factor of a transformer is evaluated by computing the energy input to the transformer and the peak load on the transformer and the hours for which the transformer is in service
ENERGY LOSSES IN THE POWER DISTRIBUTION SYSTEM • Loss Load Factor is computed by using the formula LLF = 0.3 (LF) + 0.7 (LF)² Commercial losses are assessed by deducting technical losses from the total losses of the feeder, i.e. the difference between energy sent out and the energy sold. Commercial loss in the feeder = Energy loss – Technical loss.
DETERMINING COMMERCIAL LOSSES The following activities are undertaken to record these losses: The meter reading schedules of meter readers are revised and made coterminous with distribution transformers. The distribution transformer meter is also read and comparison is made between distribution transformer meter reading and sum total of consumption recorded in all other consumer meters coming under that distribution transformer. The difference is noted. If the losses are found to be high, action is initiated to trace the installation causing losses.
Actions Recommended for Reducing Technical Losses Reconfiguration; Reconductoring; Employing Shunt Capacitors; Conversion from Single Circuit to Double Circuit; Setting up of more substations; Changeover from Low Voltage Distribution System (LVDS) to High Voltage distribution System (HVDS).
Actions Recommended for Reducing Commercial Losses Changeover to static meters with tamper proof data and remote metering facility; Replacing all burnt, stuck up, non-performing and underperforming meters; Calibrating the existing meters; Flying squads and Special task force for detection of pilferage of energy; AMR for online energy recording.
IT in Energy Accounting and Energy Audit • Energy accounting and energy audit is an important tool for the utility, which provides the means to identify the areas of leakage, wastage or inefficient use of energy • It helps in identifying measures suitable for reduction of T&D losses and can lead to significant cost and energy savings
ENERGY AUDITING IN A POWER UTILITY INVOLVES Identifying energy losses and quantifying them; Segregating the losses into technical and commercial losses; Estimating the energy conservation potential of a system; and Proposing economically viable and attractive solutions.
PROCEDURE FOR CONDUCTING AN ENERGY AUDIT 1. Gathering and collecting information in a specially designed, “Energy Systems Questionnaire” format, for the Utility under study, 2. Inter-and – intra-utility comparison of the collected data. 3. Assessment of present efficiency index for energy consumption in the utility/transformation. 4. In-depth study of utility operation, equipment and system for a general review of the energy systems to assess the operational efficiency and potential for economising.
PROCEDURE FOR CONDUCTING AN ENERGY AUDIT 5. Evaluation of the detailed recommendations for energy conservation, 6. Formulation of detailed action plans / strategies in consultation with plant management for implementation of the identified energy saving measures. 7. Training operating personnel in the specifics of energy conservation to enable them to implement the recommendations and also to monitor the progress on a periodic basis.
Successful Projects All the utilities of AP have implemented the following IT applications, which are working satisfactorily providing better customer service • Web based applications for bill enquiry and bill payment to provide ease of payments • Centralized trouble call centre for fuse off call complaints • Spot billing using Hand held computers • Consumer analysis tool to identify high risk class of customers • Monitoring and tracking system for pilferage of energy cases. • Transformer information and management system
Successful Projects MSEDCL implementing photo metering for metering of the LT consumers. • Photo Metering: Data entry software embedded in the digital camera. Image of the meter is uploaded to the computer which also captures the meter reading and then the bill is generated. • Photographs are processed through software and converted into an MSEDCL defined format • The company reports 40% increase in consumption after introduction of this method.
THE FINAL WORD It is left to your ingenuity to look for more IT applications to improve the Distribution system efficiency at large to make the power sector A REALLY POWERFUL SECTOR