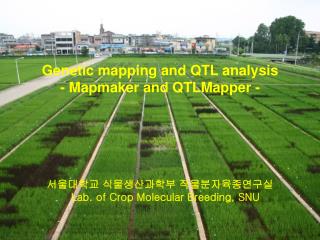
Genetic mapping and QTL analysis - Mapmaker and QTLMapper -
370 likes | 1.14k Vues
Genetic mapping and QTL analysis - Mapmaker and QTLMapper -. 서울대학교 식물생산과학부 작물분자육종연구실 Lab. of Crop Molecular Breeding, SNU. Construction of genetic linkage map using Mapmaker - For example, using RILs data QTL analysis using QTLMaper. Contents. 양적형질의 유전기작을 알기 위한 통계유전학적 도구 .

Genetic mapping and QTL analysis - Mapmaker and QTLMapper -
E N D
Presentation Transcript
Geneticmapping and QTL analysis - Mapmaker and QTLMapper - 서울대학교 식물생산과학부 작물분자육종연구실 Lab. of Crop Molecular Breeding, SNU
Construction of genetic linkage map using Mapmaker - For example, using RILs data QTL analysis using QTLMaper Contents
양적형질의 유전기작을 알기 위한 통계유전학적 도구. QTL 분석은 유전자표지를 이용하여 양적형질에 관여하는 염색체의 특정부분을 확인,형질의 유전적 배경에 대한 직접적인 정보를 제공함. 수량성, 출수기 등 주요형질에 QTL 분석을 이용하여 관여하는 유전자의 수 및 염색체의 위치, 유전자의 영향력, 상위적효과, QTL과 환경의 상호작용 등에 대한 전반적인 정보를 얻을 수 있음. 주요농업형질의 표현형의 차이가 자연변이에 의해 조절되고 특정 농업환경에서 관찰되기 때문에 실내에서 수행되는 돌연변이 분석보다는 표현형의 차이를 실제로 파악할 수 있음. Functional genomics의 연구결과와 농업환경에서의 자연변이 정보를 서로 결합함으로써 QTL 분석은 식물육종과 분자유전학을 연결하는 가교역할을 함. QTL 관여 유전자의 fine mapping 혹은 QTL 클로닝 및 기능 분석을 통해서 분자표지선발육종 (MAS)의 효과적인 이용이 가능함. QTL 분석의 용도
형질의 유전력 유전집단의 유형과 크기 유전자지도의 밀도와 마커의 게놈 커버링 정도 형질에 관여하는 유전자의 수와 게놈상의 위치 유전집단에서 분리하는 유전자의 수 유전효과의 유형과 QTL간 상호작용의 존재여부 실험설계 (난괴법, 반복수) 통계분석방법 QTL 분석에 영향주는 요인
Mapmaker Maximum likelyhood algorism JoinMap 3.0 Stepwise algorism JoinMap 4.0 Maximum likelyhood algorism Genetic mapping software
Single point analysis (SPA) Multiple linear regression (MLG) Interval mapping (IM) Composite interval mapping (CIM) Mixed linear model approaches (MCIM) The statistical methodology of QTL analysis
Genotype analysis and scoring T N N N H H B H B N N H N H H H N N H H H H B H N H H B M H B H B genotypes 2 1 1 1 3 2 2 1 3 1 3 3 3 1 1 3 3 3 2 1 3 1 3 2 1 2 2 Example for marker coding scheme in F2 population
전기영동결과의 scoring 과정에 반드시 구분 가능한 모든 유형을 나타내야 됨. data의 정확성 – 신뢰성이 낮은 data는 분석에서 제외 data의 합리성, 편이분리 data 등 제외 Mapping 과정에서 data management의 주의점
Data type: f2 intercross f2 backcross f3 self ri self ri sib 166 – no. of progeny 218 – no. of genetic loci 0 – no. of traits Data format for RILs in Mapmaker
Hwh2=mutant; 1=normal phenotype; 2=mutant phenotype; 3=heterozygote Data format for F2 in Mapmaker
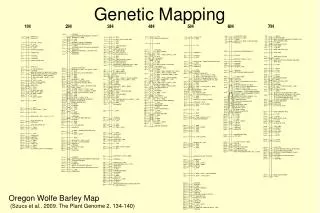
♦In MT RI population, an integrated genetic linkage map consisting of 119 SSR and 97 STS markers was constructed. ♦ The overall map length is approximately 1, 666.2cM, and average distance between adjacent two markers is 7.64cM.
QTL analysisusing QTLmapper1.06 A Computer Software for Mapping Quantitative Trait Loci (QTLs) with MainEffects, Epistatic Effects and QTL × Environment Interactions http://ibi.zju.edu.cn/software/qulmapper/index.htm
Working with settings sub-menu • Work directory - C:\QTLMapper • File format – three format (QTLMapper, QTLCart., Mapmaker/QTL) • Backgroud genetic variation(BGV)-One of the major factors affecting the precision resolution and power in mapping QTLs. The choice Main &interaction markers is recommended. • Marker coding • P1=A, P2=B, F1=H, F1P1=C, F1P2=D • Map function- Kosambi • Probabilities • Walking speed • Save settings
To use QTLMapper 1.0 for QTL mapping analysis, need to get marker linkage map, and data of markers and traits into two plain text files (a map file and a data file) in a format recognized by QTLMapper 1.0. Preparing input files
Working with file sub-menu Mtriqli.txt tm.map
Working with run sub-menu • 2 and 3. Map additive-effect QTLs/epistasis Step1. setting a name for result file Step2. setting mapping ranges Instead of all the traits and the entire genome Step3. Chosing a method for saving mapping results
Step4. Diciding a hypothesis for LR test Step5. Deciding whether to continue the process for QTL mapping Step6. Deciding whether to redo marker selection. The selected main-effect markers will be saved in a file with extension of “.one”, while the selected pair-wise interaction markers are saved in another file with extension of “.two”.
Step7. Deciding whether to filtrate putative main-effect/epistasis QTLs. If the LR value at a peak is above the threshold, the testing point with this LR value will be kept and saved in a file with the same stem name as the original result file and extension of .flq (for additive-effect QTLs) or .fle (for epistatic QTLs). Step8. Deciding whether to conduct Bayesian test for the putative maine- effect/ epistasis QTLs. The results from Bayesian test will be saved in a file with the same stem as that for the original result file and extension of .byq (for additive-effect QTLs) or .bye (for epistatic QTLs) in the work directory. Step 9. Deciding whether to calculating relative contributions for putative main-effect/ epistatic QTLs. The results for the relative contributions will be saved in a file with the same stem as that for the original result file and extension of .ctq (for additive-effect QTLs) or .cte (for epistatic QTLs) in the work directory.
4.Marker Detection This item in Run sub-menu (Figure 13) is designed for selecting important main-effect and/or interaction markers that can be used in two ways: controlling BGV and automatically determining genomic ranges in mapping main-effect/epistatic QTLs.
Epistatic QTLs Main effect QTLs