ATC
Long-run (the time it takes for the industry to adjust output to the change in demand or supply) equilibrium for the purely competitive firm. MC. Zero Economic Profit. ATC. AVC. MR. P. PRICE. Q. QUANTITY. The cost curves we used in previous activities were short-run curves. MC.

ATC
E N D
Presentation Transcript
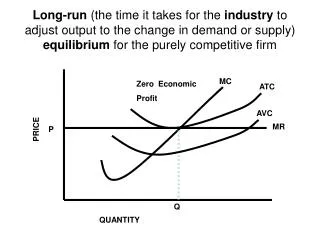
Long-run (the time it takes for the industry to adjust output to the change in demand or supply) equilibrium for the purely competitive firm MC Zero Economic Profit ATC AVC MR P PRICE Q QUANTITY
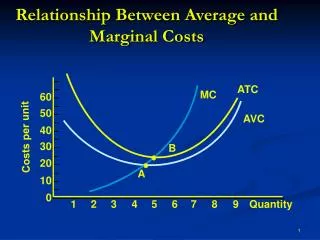
The cost curves we used in previous activities were short-run curves. MC Zero Economic Profit ATC AVC MR P PRICE Q QUANTITY
In the short-run, firms can vary output but notplant capacity. MC Zero Economic Profit ATC AVC MR P PRICE Average Fixed cost Q QUANTITY
Now we turn to the long-run: a time period in which the firmcan vary its plant capacityand output MC Zero Economic Profit ATC AVC MR P PRICE Q QUANTITY
In the short-run, the shapes of the average and marginal cost curves result from diminishing marginal productivity of the resources. MC Zero Economic Profit ATC AVC MR P PRICE Q QUANTITY
So in the long-run for the firm, we only have a total cost curve, since all costs are variable. LRATC is created from the different ATC curves (now called SRATC) of the plant capacity (different size or number of plants) over time. MC Zero Economic Profit SRATC AVC MR P PRICE Q QUANTITY
LRATC is created from the different ATC curves (now called SRATC) of the plant capacity (different size or number of plants) over time. SRATC 2 SRATC SRATC 1 LRATC PRICE QUANTITY
In the long-run for the firm, the shape of LRATC results from economies and diseconomies of scalesee chapter 9, pgs 176 - 181 SRATC SRATC3 SRATC1 SRATC2 LRATC P PRICE Q Q1 QUANTITY
Sources ofEconomies of scale • Specialization in resources • More efficient uses of equipment • A reduction of per-unit costs of factor inputs • An effective use of production by-products • An increase in shared facilities
Sources ofDiseconomies of scalesee chapter 10, pgs 204-205 • Limitations on management decision making • Competition for factor inputs
Quick Quiz #1 what do the minimum points of each of the short-run ATC curves represent? SRATC SRATC 2 SRATC 1 P PRICE Q Q1 QUANTITY
Quick Quiz #1 what do the minimum points of each of the short-run ATC curves represent? SRATC SRATC 2 SRATC 1 P PRICE Q Q1 QUANTITY
Quick Quiz #2the firm can minimize costs by producing output level Q using firm size _______. This means it would be over/under utilizing firm size SRATC / SRATC1 SRATC SRATC 2 SRATC 1 LRATC P PRICE Q Q1 QUANTITY
the firm can minimize costs by producing output level Q using firm size SRATC. This means it would be over utilizing firm size SRATC SRATC SRATC 2 SRATC 1 LRATC P PRICE Q Q1 QUANTITY
Quick Quiz #3label the optimum output level in the graph as QLR SRATC SRATC 2 SRATC 1 LRATC P PRICE Q Q1 QUANTITY
QLR: the optimum output level SRATC SRATC 2 SRATC 1 LRATC P PRICE Q QLR Q1 QUANTITY
Quick Quiz #4To produce at output level Q1, the firm should use plant size ______.This would over / under utilize plant size (SRATC1 / SRATC2) SRATC SRATC 2 SRATC 1 LRATC P PRICE Q Q1 QUANTITY
To produce at output level Q1, the firm should use plant size SRATC2.This would underutilize plant size SRATC2 SRATC SRATC 2 SRATC 1 LRATC P PRICE Q Qlr Q1 QUANTITY
Quick Quiz #5The firm experiences economies of scale up to output level ____ , and diseconomies of scale beyond output level _____. SRATC SRATC 2 SRATC 1 LRATC P PRICE Q QLR Q1 QUANTITY
The firm experiences economies of scale up to output level QLR, and diseconomies of scale beyond output level QLR. SRATC SRATC 2 SRATC 1 LRATC P PRICE Q QLR Q1 QUANTITY
the firm, in the graph, experiences constant returns to scalebetween output levels Q1 and Q2.Give an example of a type of firm that experiences constant returns to scale. SRATC SRATC3 SRATC1 SRATC2 LRATC P PRICE Q Q1 Q2 Q3 QUANTITY
Constant returns to scale • changes in the number of firms in the industry have little effect on the costs of individual firms in the industry • Furniture industry • There are trees available for lots of reasons, from housing, to paper, to Christmas trees, to furniture, and any one furniture firm is a relatively small percentage of the total demand for wood • Household appliance industry • There is steel available for lots of industries, and any one household appliance firm is a relatively small percentage of the demand for steel