Sequence Length (bp)
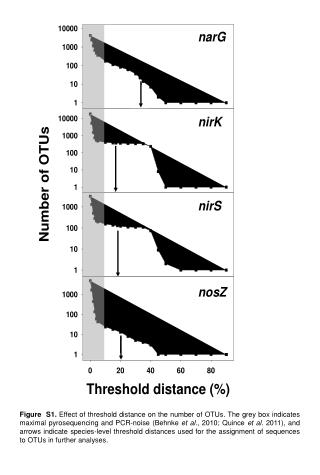
Figure S1. Effect of threshold distance on the number of OTUs. The grey box indicates maximal pyrosequencing and PCR-noise (Behnke et al ., 2010; Quince et al . 2011), and arrows indicate species-level threshold distances used for the assignment of sequences to OTUs in further analyses.

Sequence Length (bp)
E N D
Presentation Transcript
Figure S1. Effect of threshold distance on the number of OTUs. The grey box indicates maximal pyrosequencing and PCR-noise (Behnke et al., 2010; Quince et al. 2011), and arrows indicate species-level threshold distances used for the assignment of sequences to OTUs in further analyses.
Figure S2. Effect of supplemental nitrate or nitrite on the ratio of N2O to total N gases. Mean values and standard errors of three replicates are shown. The Spearman correlation coefficient r for nitrate and nitrite to the ratio of N2O to total N gases was 1.0 and 0.9, respectively.
Figure S3. Concentrations of organic acids and ethanol during anoxic microcosm incubations of peat soil after anoxic pre-incubation for 9 days to deplete nitrate and nitrite. Electron donors and nitrite were supplied at 0 and 1080 h as indicated by arrows. (1) unturbated and (2) cryoturbated peat soil; (A) Unsupplemented, (B) nitrite only, (C) nitrite and acetate, (D) nitrite and ethanol, (E) nitrite and formate, (F) nitrite and propionate, (G) nitrite and butyrate, and (H) nitrite and lactate. Samples of duplicate incubations were pooled per timepoint prior to analysis. Concentrations of acetate (closed squares), ethanol (open squares), formate (closed circles), propionate (open circles), butyrate (closed triangles), and lactate (open triangles) were measured.
100 A 50 0 350 400 450 500 550 4000 Number of Sequences B 2000 0 300 350 400 450 500 Sequence Length (bp) Figure S4. Distribution of sequence read lenghts obtained by pyrosequencing of structural genes. A: narG, B: nirK, C: nirS, D: nosZ. Only sequences longer than 300 bp (nirK, nirS) and 350 bp (narG, nosZ) are shown..
1100 C 550 0 550 300 350 400 450 500 Number of Sequences 300 D 150 0 350 400 450 500 Sequence Length (bp) Figure S4 (continued). Distribution of sequence read lenghts obtained by pyrosequencing of structural genes. A: narG, B: nirK, C: nirS, D: nosZ. Only sequences longer than 300 bp (nirK, nirS) and 350 bp (narG, nosZ) are shown..
Figure S5. Rarefaction analysis of narG forward (A) and reverse (B), nirK (C), nirS (D), nosZ foward (E) and reverse (F) sequences retrieved from unturbated (dashed lines) and cryoturbated (solid lines). Rarefaction curves and 95% confidence intervals are shown. Vertical lines indicate 250 sequence-level for comparisons of rarified number of OTUs [n(OTUs)]. Such comparisons of the rarified number of OTUs are less sensitive to accumulating PCR- and Pyrosequencing noise than utilizing all sequences obtained (Dickie, 2010).
Figure S6. Phylogenetic tree of narG reverse reads retrieved from unturbated and cryoturbated peat soil. The tree is based on translated amino acid sequences. Representatives for each OTU are shown. Relative abundances of sequences from unturbated and cryoturbated peat soil are shown in parentheses per OTU. Codes preceeding sequence names represent sequence accession numbers in public databases. In total, 2 044 and 3 906 sequences from reverse reads were obtained from unturbated and cryoturbated peat soil, respectively. Grey boxes indicate branches where the majority of sequences are derived from reference strains of a certain phylogenetic class. The percentage of replicate trees in which the associated taxa clustered together in the bootstrap test (10 000 replicates) are shown next to the branches. Values below 50% have been omitted. The outgroup was narG of Haloarcula marismortui ATCC 43049 (NC 006396).
Figure S7. Phylogenetic tree of nosZ reverse reads retrieved from unturbated and cryoturbated peat soil. The tree is based on translated amino acid sequences. Representatives for each OTU are shown. Relative abundances of sequences from unturbated and cryoturbated peat soil are shown in parentheses per OTU. Codes preceeding sequence names represent sequence accession numbers in public databases. In total, 1 919 and 3 664 sequences from reverse reads were obtained from unturbated and cryoturbated peat soil, respectively. Grey boxes indicate branches where the majority of sequences are derived from reference strains of a certain phylogenetic class; white boxes indicate minority sequences from genera not affiliated with the indicated class. The percentage of replicate trees in which the associated taxa clustered together in the bootstrap test (10 000 replicates) are shown next to the branches. Values below 50% have been omitted. The outgroup was nosZ of Haloarcula marismortui ATCC 43049(NC 006396).