Download
1 / 18
180 likes | 315 Vues
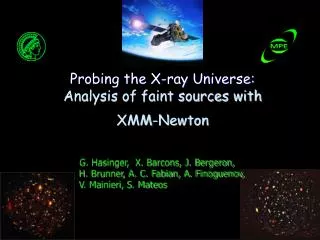
Probing the X-ray Universe: Analysis of faint sources with XMM-Newton. G. Hasinger, X. Barcons, J. Bergeron, H. Brunner, A. C. Fabian, A. Finoguenov, V. Mainieri, S. Mateos. The exposure time for good quality observation added up to ~ 370 ksec (XMM)

E N D
Probing the X-ray Universe:Analysis of faint sources withXMM-Newton G. Hasinger, X. Barcons, J. Bergeron, H. Brunner, A. C. Fabian, A. Finoguenov, V. Mainieri, S. Mateos
The exposure time for good quality observation added up to ~ 370 ksec (XMM) 1Ms Chandra dataset (Giacconi et al. 2002) The EPIC instruments have unprecedent high sensitivity in the hard X-ray band, and in the [5-10] keV band our dataset is comparable to the 1Ms Chandra image. CDFS: XMM PN+MOS RA 3:32:28 and DEC -27:48:30 (J2000).
The total number of sources with spectral or photometric redshift is 343/347(only 4 X-ray sources non identified!!!). The final sample is 321 (Chandra, Tozzi et al. 2005) or 123 sources (XMM-Newton, Streblyanska et al. 2005).
Chandra: 346 sources XMM: 324 sources (> 3 σ) 168 overlap (within 6”) +15 (< 3 σ) + 10 double in Chandra = 193 sources detected in both surveys The average distance 2-3” 145 sources detected in XMM only (some within the Chandra image!).
From optical identifications we know that the dominant population in both surveys is a mixture of obscured (type-2) and unobscured (type-1) AGNs, with a small fraction of groups/clusters of galaxies. The fraction of obscurated objects increase at lower flux.
Soft excess in the distant type-2 QSOs A class of highly luminous type-2 AGN (QSO-2), at first has been detected in the deepest radio survey (Norman et al. 2002, Stern et al. 2002, Lehmann et al. 2002). In our field, at z>2.5, there are seven type-2 QSOs, but only one is possible to analyse as individual spectrum. All these objects have narrow Ly-α and CIV emission, HR > -0.2, and faint optical magnitudes R ≥ 24.0
Stacking spectrum of the most distant type-2 QSOs Our integrated spectrum shows an absorption with clear soft excess, which we fit by scattering model. zint=3.081 Γ = 2.14±0.13 NH =9 ×1023 cm-2 Covering fraction 0.96±0.2
The rest frame spectra in deep fields. The next step after investigating the individual spectra was to group the faint objects by source classification and combine their spectra in order to determine general spectral properties for each type of object. A relativistic Fe line in the mean X-ray spectra of type-1 and type-2 AGNs. (A. Streblyanska, G. Hasinger, A. Finoguenov, X. Barcons, S. Mateos and A. C. Fabian. 2005, A&A 432, 395)
ASCA relativistic Fe-line (Tanaka et al. 1995) Approaching the Black Hole A diversity in line shapes have been recently reported, as relativistic iron lines have been discovered in some objects with ASCA (Tanaka et al. 1995) and confirmed with XMM-Newton (Wilms et al. 2001, Fabian et al. 2002). The Fe line background. (Brusa et al. 2005)
The remaining exposure times after cleaning are approximately 700-800 ksec (pn-MOS1-MOS2) The deepest XMM observation, a large total solid angle, an extensive optical identification of AGN population. 53 type-1 AGN 41 type-2 AGN Lockman Hole: XMM pn+MOS1/2 RA 10:52:43 and DEC +57:28:48 (J2000)
Spectral analysis • Each individual spectrum was fit with a single power law model • Both the ratio of the data to the model as well as a reconstructed unfolded spectrum was saved. • Each spectrum was shifted to the rest frame: • ●For the ratio we increase the energies by the • factor of (1+z). • ●For the unfolded spectra we used the same energy band to renormalize the spectra to the same value for further averaging and increase the energies by the factor of (1+z). • An average spectrum was created with a bin width of 0.25 keV for energies lower than 8 keV and a bin width 2 keV above.
The resulting ratio plots from mean unfolded spectra obtained by using averaging methods. The unfolded spectra are fit with a power-law model in the ranges 0.2-3 and 8-20 keV. The ratio from the stacked unfolded spectrum (power law model) type-2 AGN type-1 AGN EW = 455±40 eV EW = 560±100 eV
wabs * wabs(po + linemodel) NH = 5.7 × 1019 cm-2 (fixed) Photon index = 1.74±0.2 and 1.6±0.2 NH = 8±1 × 1020 cm-2 NH = 5.2±0.9 × 1020 cm-2 * fixed Type-1 AGN: Unfolded spectra Type-2 AGN: Unfolded spectra
DiscussionThe large EW as the result of a high metallicity(?) One of the explanations for the large EWs can be given by a model including ionized disc reflection with lines and edges from different ionization stages of iron blurred together by relativistic effects (Fabian et al. 2002b). This model can account for all the observed spectral features, but yields a large iron overabundance of 3-7 × solar as an explanation of the observation (Tanaka et al. 2004, Boller et al. 2003). In our case we need an iron abundance of 3 × solar (as needed for MCG-6-30-15) in order to obtain a high EW. An additional reason why our large equivalent width may be connected with a large metallicity is that most of our objects are quite distant and rather luminous AGNs. distant and luminous AGN->high metallicity-> the large equivalent widths Shemmer et al. (2004) The metallicity is correlated with the accretion rate, which is in turn related to the luminosity.
We derive an average rest-frame spectrum of AGN type one and two. The most prominent feature in the averaged spectrum is a presence of the fluorescent Fe line. • The average rest-frame spectrum of the XRB sources shows a strong, relativistic iron line, possibly due to a high metallicity in the average population. • The strong red wing of the line feature indicates some component of spin in the average black hole. • A very broad line feature is expected in the average X-ray background spectra (Fabian et al. 2000, Gilli et al. 2001), which should be included in future population synthesis models for the X-ray background. Conclusion
+ LH 53 type-1 AGN 41 type-2 AGN CDFS 78 type-1 AGN 35 type-2 AGN Future work: Equivalent widths as a function of z, flux, luminosity and etc.