Download

1 / 118
1.19k likes | 1.49k Vues
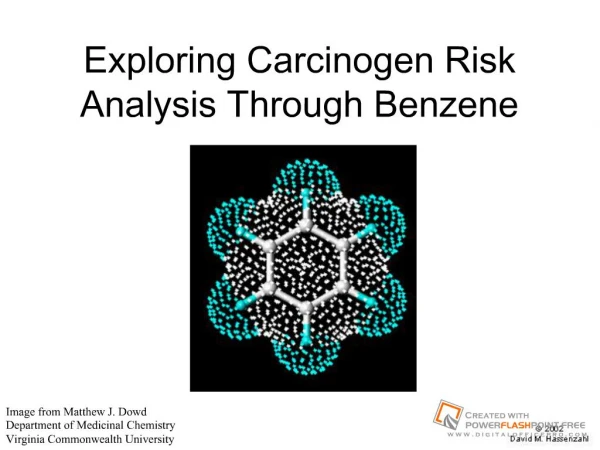
Exploring Carcinogen Risk Analysis Through Benzene. Image from Matthew J. Dowd Department of Medicinal Chemistry Virginia Commonwealth University. Objective. Use benzene as a case for exploring Toxicology Epidemiology Uncertainty Regulatory Science. Toolbox Building.

E N D
Exploring Carcinogen Risk Analysis Through Benzene Image from Matthew J. Dowd Department of Medicinal Chemistry Virginia Commonwealth University 2002 David M. Hassenzahl
Objective • Use benzene as a case for exploring • Toxicology • Epidemiology • Uncertainty • Regulatory Science 2002 David M. Hassenzahl
Toolbox Building • Likelihood Maximization • Curve fitting • Bootstrapping • Z-Scores • Relative Risk • Dose-Response extrapolation 2002 David M. Hassenzahl
Overview of benzene • Fairly common hydrocarbon • Manufacturing • Petroleum products • Strongly suspected human carcinogen • Animal assays • Many epidemiological studies • Leukemia as important endpoint 2002 David M. Hassenzahl
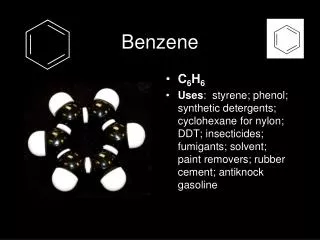
Benzene structure Image from Matthew J. Dowd Department of Medicinal Chemistry Virginia Commonwealth University 2002 David M. Hassenzahl
Benzene Data in Should We Risk It? • Toxicological Data, p. 175 et seq. • Epidemiological Data p 211 – 216 • But many other data sets • Other toxicological data (rare) • Chinese workers • Turkish workers 2002 David M. Hassenzahl
Toxicology Data Set 2002 David M. Hassenzahl Crump and Allen 1984
What are risks from benzene? • Risk as potency times exposure • How do we determine potency? • Extrapolate from animal data? • Extrapolate from epidemiological data? • How wrong will we be? • What are “real” exposures? • What are effects at these levels? 2002 David M. Hassenzahl
Toxicology • Paracelsus “the dose makes the poison” • Regulatory assumptions! • This is not Dr. Gerstenberger’s Toxicology! 2002 David M. Hassenzahl
Reading • SWRI Chapter 5 • US EPA Proposed guidelines (US EPA 1996) • Cox 1996 2002 David M. Hassenzahl
General idea • Applied doses • Greater specificity about exposure than epidemiology • Observed effects • Artificial control of exposure 2002 David M. Hassenzahl
Physiologically Based Pharmacokinetics • PBPK • Investigate flows of materials through bodies • System dynamics models • More on these in exposure lecture 2002 David M. Hassenzahl
Studies • Animals • Rarely humans • Parts • Cell • tissue 2002 David M. Hassenzahl
Effects • Chronic • cancer fatality • increasing interest in other issues • lead and intelligence in children. • Acute • Reversible • Irreversible 2002 David M. Hassenzahl
Crump and Allen Benzene data set • Animals at various concentrations • Four data points • “Designer” mice 2002 David M. Hassenzahl
Relevance to Humans • How to get from • high level, lifetime studies of animals to • anticipated low dose effects in humans? 2002 David M. Hassenzahl
Questions about benzene • Is benzene a mouse carcinogen? • Is benzene a human carcinogen? • If so, how potent? 2002 David M. Hassenzahl
Benzene data set I Crump and Allen data set (Crump and Allen 1984) Note: the actual doses are not stated correctly here. See “notes for more information 2002 David M. Hassenzahl
Benzene data set II 1.0 0.8 0.6 P(cancer) 0.4 0.2 0 0 25 50 75 100 Dose (mg/kg/day) Crump and Allen data set. 2002 David M. Hassenzahl
Uncertainty Pervades • Often understated • Creates (or at least prolongs) conflict • Think as we go! (Part of Homework PS 2) 2002 David M. Hassenzahl
Animal Test Issues • Interspecific comparison • Statistical uncertainty • Heterogeneity • Extrapolation • Dose Metric 2002 David M. Hassenzahl
Interspecific comparison • Mouse-human • Metabolism as a function of body weight • Dosehuman = sf Dosemouse • sf = (BWhuman/BWmouse)1-b • b is empirically derived as 0.75a a. See SWRI page 177. 2002 David M. Hassenzahl
Interspecific comparison • Lifetime of human = lifetime mouse? • Mice age 30 days per human day • Total mouse lifetime is much shorter • Analogous organs or processes? • Do mice have cancer points we do not? • Do we have cancer points mice do not? a. See SWRI page 177. 2002 David M. Hassenzahl
Interspecific comparison 1. Hallenbeck, 1993 2. Finley et al., 1994 2002 David M. Hassenzahl
Interspecific comparison sf = (BWhuman/BWmouse)1-b sf = (70/0.03)0.25 = 7.0 Dosehuman = 7.0 Dosemouse 2002 David M. Hassenzahl
Interspecific comparison Crump and Allen data set, converted to humans 2002 David M. Hassenzahl
Animal Test Issues • Interspecies comparison • Statistical uncertainty • Heterogeneity • Extrapolation • Dose Metric 2002 David M. Hassenzahl
Binomial Distribution • 50 genetically “identical” mice…binomial distribution? • Can use this to generate “likelihood function” to compare the likelihood that any given probability is 2002 David M. Hassenzahl
Likelihood Maximization • More appropriate than Least Squares when you know something about likelihoods • “Bootstrapping” method needed • We will work through likelihood maximization 2002 David M. Hassenzahl
Statistical Uncertainty Can calculate standard deviation using the binomial Recall that two standard deviations to either side represents a 95% confidence interval, and... 2002 David M. Hassenzahl
Statistical Uncertainty 1.0 0.8 0.6 P(cancer) 0.4 0.2 0 0 175 350 525 700 Human Dose (mg/kg/day) Crump and Allen data set, applied to humans 2002 David M. Hassenzahl
Animal Test Issues • Interspecies comparison • Statistical uncertainty • Heterogeneity • Extrapolation • Dose Metric 2002 David M. Hassenzahl
Heterogeneity • Epidemiology and toxicology • Genetically identical mice compared to diverse humans • Predictable versus unpredictable susceptibility • Male and female differences (observed cancer rates are different) 2002 David M. Hassenzahl
Heterogeneity • Genetic diversity among humans • Early insights into cancer mechanism: subpopulation born with one of two “steps” competed • Variability as a function of age 2002 David M. Hassenzahl
Animal Test Issues • Interspecies comparison • Statistical uncertainty • Heterogeneity • Extrapolation • Dose Metric 2002 David M. Hassenzahl
Extrapolation • Theoretical or “Mechanistic” models: • one-hit • two-hit • two-stage • Empirical • Cox “data-driven, model free curve fitting” • EPA Proposed Guidelines 2002 David M. Hassenzahl
Overestimation Tautological effects Thresholds Hormesis, or “Vitamin” effect Underestimation Saturation Synergistic effects Susceptibility Omission Extrapolation Concerns 2002 David M. Hassenzahl
2002 David M. Hassenzahl
After EPA (1996) 2002 David M. Hassenzahl
Statistical Uncertainty 1.0 0.8 0.6 P(cancer) 0.4 0.2 0 0 175 350 525 700 Human Dose (mg/kg/day) Crump and Allen data set, applied to humans 2002 David M. Hassenzahl
1.0 LED(10) = 100 mgb/kg/day 0.8 0.6 P(cancer) 0.4 0.2 0 0 175 350 525 700 Human Dose (mg/kg/day) 2002 David M. Hassenzahl
Extrapolation If LED(10) = 100 mg/kg/day, then LED(10-6) = 100 10-6 / 0.1 = 1 10-4 mg/kg/day 2002 David M. Hassenzahl
Animal Test Issues • Interspecies comparison • Statistical uncertainty • Heterogeneity • Extrapolation • Dose Metric 2002 David M. Hassenzahl
Dose Metric • Assumption: exposure is irrelevant to effect • Area under the curve/expected value. • Lifetime dose leads to average daily dose. • Particularly problematic if there are threshold effects or extreme effects 2002 David M. Hassenzahl
Risk to Humans? • Lifetime cancer risk • 40 hours per week • 50 weeks per year • 30 years • Average 10 ppm(v) exposure? 2002 David M. Hassenzahl
Calculate Risk • 10ml benzene/liter air • 0.313 ml/mg • 20m3 air / day • 1000 liters/ m3 • 70kg person 2002 David M. Hassenzahl
Cancer Risk • Lifetime Cancer Probability is a function of Dose and Potency • Assume cumulative dose • Use Daily Dose per kg body weight, averaged over lifetime • Potency usually given as q* • Additional risk per unit dose 2002 David M. Hassenzahl
Cancer Risk: Exposure Term 2002 David M. Hassenzahl
Computed Exposure Terms 2002 David M. Hassenzahl
Computed Exposure Terms 2002 David M. Hassenzahl