Download
1 / 32
320 likes | 899 Vues
DEFINITIONS. PhonocardiogramGraph representing sounds made by the human heartCardio cycleRepresented by S1, S2, S3 and S4S1Orignates at the closure of the atrioventricular valvesrecordable between 91hz and 179 hzS2Originates at the aortic an pulmonic valvesCan reach 200 hzS3 and S4Represent cardiac wall vibrationsNot all audible, low density.

E N D
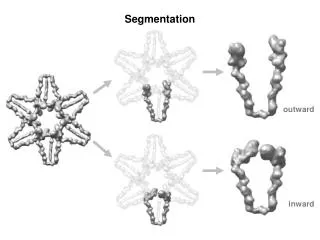
1. SEGMENTATION ON PHONOCARDIOGRAM Professor Kuh
EE645 FINAL PROJECTS
By Rebecca Longstreth
3. DEFINITIONS S1 and S2
Sound goes left to right
S3 and S4
Right to left
4. Reason for Segmentation Tool to assist doctors in diagnosing heart malfunctions accurately
Prevents mistakes in diagnoses
Improved quality care for patients
Doctors experience benefits everyone
5. Choices of Segmentation Fourier transform
Laplace transform
Wavelet decomposition
6. Fourier transform Reasons not used:
Phonocardiograms are not smooth wave signals
Not linear time invariance
Non-stationary
Non-harmonic
7. Laplace transform Reasons not used:
Initial condition does not exist
8. Wavelet decomposition Preferred method of analyzing phonocardiograms
Time limited and frequency limited
Utilize digital filters and down sampling
9. Wavelet decomposition conditions Normalize the amplitude of all artifacts before transformation to avoid amplification errors
Short segmentation window for high frequency
Long segmentation window for low frequency
Short lengths of data are considered due to file size considerations
10. Phonocardiogram anomalies Fetal acoustic signals inconsistent from one sound to the next
Wave shape can change
Frequency could shift
Amplitude, duration and position in the cardiac cycle can change
Background noise of the mother and the shielding affect of the womb
11. GOAL Isolate one cycle for analysis
Identify S1 and S2
Boundaries of S1 and S2
Systolic and diastolic periods
Systolic: time interval from beginning of S1 to the beginning of S2
Diastolic: time interval from beginning of S2 to the beginning of S1
Associate frequency spectrum
12. Research According to Cardiologists interviewed
There is no way to recognize S1 and S2 using only a phonocardiogram
Location of the probe can radically affect the signal strengths of S1 and S2 on the same individual
13. Finding S1 and S2: Method 1 Compare EKG and the phonocardiogram simultaneously to ensure accurate designation of S1 and S2
S1 occurs shortly after the EKG peak
The first PCG signal following the EKG peak is S1
S2 occurs shortly after the 2nd EKG peak
14. Finding S1 and S2: Method 1 Disadvantage
EKG requires expensive bulky and fragile equipment to perform
Need
Robust, portable, easy to use low cost equipment
16. Wavelet Decomposition
Heart sounds (sampled at an 8kHz sample rate, 16 bits/sample) are first hand segmented into 4096 sample segments, each consisting of a single heartbeat cycle.
17. Feature Reduction & Denoising Figure 1. A Simple Heart Sound Classification System
.Each segment is transformed using a 7 level wavelet decomposition, based on a Coifman 4th order wavelet kernel (relative symmetry and fast execution).
The resulting transform vectors, 4096 values in length, are reduced to 256 element feature vectors by discarding the 4 levels with shortest scale.
Neural network in the classifier reduces noise. The magnitudes of the remaining coefficients in each vector are calculated, then normalized by the vector�s energy.
18. Classification Each feature vector is classified using a three layer neural network (256 input nodes, 50 hidden nodes, and 5 output nodes).
19. Results And Discussion RESULTS AND DISCUSSION
The system was evaluated using heart sounds corresponding to
normal
mitral valve prolapse(MVP)
coarctation of the aorta (CA),
ventricular septal defect (VSD),
and pul-monary stenosis (PS).
The classifier was trained using 10 shifted versions (over a range of 100 samples) of a single heartbeat cycle from each type.
20. Figure 2. Representative Heart Sounds (left to right) Without Added Noise, with Noise Variance 1000,and with Noise Variance 3000, x-axis is the number of sample segments
21. Figure 2. Representative Heart Sounds (left to right) Without Added Noise, with Noise Variance 1000,and with Noise Variance 3000,x-axis is the number of sample segments
22. Figure 3. Feature Vectors Corresponding to the Heart Sounds in Figure 2, x-axis is the number of feature vectors
23. Figure 3. Feature Vectors Corresponding to the Heart Sounds in Figure 2, x-axis is the number of feature vectors
24. Figure 3. Feature Vectors Corresponding to the Heart Sounds in Figure 2,x-axis is the number of feature vectors
25. Figure 3. Feature Vectors Corresponding to the Heart Sounds in Figure 2,x-axis is the number of feature vectors
26. Feature vectors with additive noise The feature vectors produced for these examples in Figure 3.
key features remain relatively stable even with addiditive noise.
27. Figure 4. Classification Accuracy (in Percent) as a Function of the Variance of the Added Noise
28. Figure 5. Classification Accuracy as a Function of Signal-to-Noise Ratio (in dB)
29. the sounds differ widely (e.g., by a factor of approximately 16:1 comparing a typical normal heartbeat
with one exhibiting VSD). Accounting for this variation, classification accuracy as a function of signal-to-
noise ratio (SNR) is shown in Figure 5. For an SNR above 31dB (which is easily obtainable under
most practical circumstances) classification accuracy is 100%.
30. REFERENCES
Barschdorff, D., U. Femmer, and E. Trowitzsch (1995, Sept. 10-13). Automatic phonocardiogram signal analysis in infants based on wavelet transforms and artificial neural networks. In Computers in Cardiology 1995, pp. 753�756. IEEE, Vienna, Austria.
http://www.ida.liu.se/~rtslab/publications/2001/reed01a-eurosim.pdf
Barschdorff, D., U. Femmer, and E. Trowitzsch (1995, Sept. 10-13). Automatic phonocardiogram signal analysis in infants based on wavelet transforms and artificial neural networks. In Computersin Cardiology 1995, pp. 753�756. IEEE, Vienna, Austria.
Donnerstein, R. L. and V. S. Thomsen (1994, September). Hemodynamic and anatomic factors affecting the frequency content of Still�s innocent murmur. The American Journal of Cardiology 74, 508�510.
Durand, L.-G. and P. Pibarot (1995). Digital signal processing of the phonocardiogram: review of the most recent advancements. Critical Reviews in Biomedical Engineering 23(3/4), 163�219.
El-Asir, B., L. Khadra, A.H. Al-Abbasi, and M.M.J. Mohammed (1996, Oct. 13-16). Multireso-lution analysis of heart sounds. In Proc. of the Third IEEE Int�l Conf. on Elec., Circ., and Sys., Volume 2, pp. 1084�1087. Rodos, Greece.
Rajan, S., R. Doraiswami, R. Stevenson, and R. Watrous (1998, Oct. 6-9). Wavelet based bank
of correlators approach for phonocardiogram signal classification. In Proc. of the IEEE-SP Int�l Symp. on Time-Frequency and Time-Scale Analysis, pp. 77�80. Pittsburgh, PA.
31. REFERENCES
Shino, H., H. Yoshida, K. Yana, K. Harada, J. Sudoh, and E. Harasawa (1996, Oct. 31 - Nov. 3). Detection and classification of systolic murmur for phonocardiogram screening. In Proc. of the
18th Int�l Conf. of the IEEE Eng. in Med. and Biol. Soc., Volume 1, pp. 123�124. Amsterdam, The Netherlands.
http://www.cinc.org/Program/p7b-1.htm
THE ANALYSIS OF HEART SOUNDS FOR SYMPTOM DETECTION AND MACHINE-AIDED DIAGNOSIS, Todd R. Reed, Nancy E. Reed and Peter Fritzson, The Netherlands
H. Liang, S. Lukkarinen, and I Hartimo, Heart Sound Segmentation Algorithm Based on Heart Sound Envelogram, Helsinki, Finland
H. Liang, S. Lukkarinen, and I Hartimo, A Boundary Modification Mehtod for Sound Segmentation Algorithm, Helsinki, Finland
Abdelhani Djebbari, and Fethi Bereski Reguig, Short-time Fourier Transform Analysis of the Phonocardiogram Signal, Algiers