The Connectivity Scorecard
The Connectivity Scorecard. Methodology. Overview . Basic principles underlying methodology Connectivity Scorecard is designed to relate deployment and usage of ICT to economic growth Central element of Connectivity Scorecard


The Connectivity Scorecard
E N D
Presentation Transcript
The Connectivity Scorecard Methodology Presentation / Author / Date
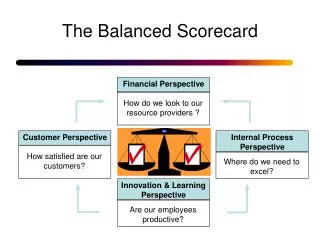
Overview • Basic principles underlying methodology • Connectivity Scorecard is designed to relate deployment and usage of ICT to economic growth • Central element of Connectivity Scorecard • Division of economy into three “pillars”– business, consumers and government • Weighting of the three pillars • Division of pillars into categories • Infrastructure and “usage and skills”– mirror “capital” and “labour” • Sources of economic welfare– utility (for consumers) and productivity (for business and government) Presentation / Author / Date
Step 1: Three Pillars of the Economy • The Connectivity Scorecard captures the link between technology and economic growth • Rather than simply put together a list of ICT indicators and weight them equally it is important to • Consider the ways in which the ICT being measured (e.g., Internet usage) affects economic activity • e.g., is this Internet usage mainly resulting in increased consumer convenience or increased business or government productivity? (likely to be both) • Consider how to weigh consumer convenience versus business productivity versus government productivity? • Thus the very first step is to divide the economy into three “pillars”– Consumers, Business and Government– and assign weights to these pillars • Then we allocate each individual ICT metric (e.g., Internet usage) to one of these pillars • We further allocate the individual ICT metric to “Infrastructure” or “Usage and Skills” Presentation / Author / Date
Connectivity Scorecard (Conceptual sketch) Consumers Business Government Allocation between pillars based National Accounts G C B Business Lines Business hardware and software E-government Schools Connected to Internet Main Telephone Lines Broadband Lines Infrastructure Split based on the split of consumer surplus between access and usage Split based on share of productivity gains between IT capital and skilled labour Split based on share of productivity gains between IT capital and skilled labour Employee ICT skills Business use of e-government Internet usage Literacy Usage & Skills Given ICT metric (e.g., literacy) is assigned to consumer, business or government– and then to “Infrastructure” or “Usage and Skills” C, B and G are weights given to consumer, business and government Presentation / Author / Date
How do we derive C, B and G? • Key considerations: • Which pillar contributes most to long-term productivity growth? (the key to increased living standards) • What does economic literature tell us about how ICT impacts on productivity growth? • Finding: ICT has impacted on economic growth primarily through its impact on business productivity • Thus: • LECG looked at the weight of business transactions, consumption, and government consumption in the economy • The ‘size’ of business transactions relative to consumption by households/individuals and consumption by government yields the weight of business relative to the weight of consumers and government Presentation / Author / Date
Example: Derivation of C, B and G for “Generic Economy” • ‘Business Transactions’ is the sum of intermediate consumption (say $500 billion) plus investment (say $100 billion) = $600 billion • “Intermediate consumption” refers to consumption of the output of one sector by another sector in order to produce a final gooda • E.g., Manufacturing sector makes billions of $ of purchases of raw materials. This is “intermediate consumption” • ‘Consumers’ is final consumption by private individuals (say $300 billion) • [purchases of finished goods and services] • ‘Government’ is final consumption by government sector (say $100 billion) • Thus: Business Transactions= $600 billion, Consumers=$300 billion, Government=$100 billion • B= $600 billion/($600 billion + $300 billion + $100 billion) = 0.60 = 60% • C= $300 billion/($600 billion + $300 billion + $100 billion) = 0.30 = 30% • G= 1-(0.60+0.3) = 0.10 = 10% Presentation / Author / Date