THE ANALYTIC HIERARCHY PROCESS EXTENSIONS
THE ANALYTIC HIERARCHY PROCESS EXTENSIONS. AHP VALIDATION EXERCISE. This exercise helps to validate the AHP. You will make judgments on the relative sizes of the areas of five shapes to find the percentage each shape contributes to the total area.


THE ANALYTIC HIERARCHY PROCESS EXTENSIONS
E N D
Presentation Transcript
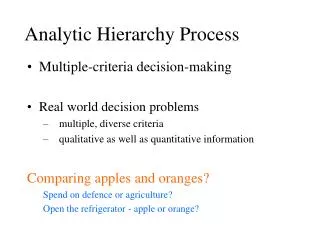
AHP VALIDATION EXERCISE • This exercise helps to validate the AHP. • You will make judgments on the relative sizes of the areas of five shapes to find the percentage each shape contributes to the total area. • The hierarchy has only two levels: the goal and the five shapes.
AHP VALIDATION EXERCISE • For example, the results might indicate that one shape is 30% of the total areas of the five shapes. • We could use plane geometry to compute the exact areas. • Using the AHP should provide estimates that are close to the actual values. • The five shapes are on the next slide.
AHP VALIDATION EXERCISE A B E D C
AHP VALIDATION EXERCISE • And now for the moment that you have all been waiting for......... • The relative size of the five shapes are: • Circle A: 0.471 • Triangle B: 0.050 • Square C: 0.234 • Diamond D:0.149 • Rectangle E: 0.096
MULTI-LEVEL HIERARCHIES • Tom Saaty suggests that hierarchies be limited to six levels and nine items per level. • This is based on the psychological result that people can consider 7 +/- 2 items simultaneously (Miller, 1956). • Brainstorming can identify several dozen criteria. • In this case, related items are grouped into categories, creating additional levels in the hierarchy.
MULTI-LEVEL HIERARCHIES • The levels can be: goal, criteria, subcriteria, and alternatives. • In Expert Choice, subcriteria are entered by highlighting the desired criterion and selecting the Edit and Insert Child of Current Node commands. • Alternatively, if many subcriteria are entered at one time, they can be dragged and dropped under the desired criteria.
MULTI-LEVEL HIERARCHIES • Consider our car evaluation problem where ten evaluation factors have been identified. • CARMULTI.AHP shows how these factors can be grouped to form a four level hierarchy: goal, criteria, subcriteria, and alternatives. • Notice that the Safety criterion has no subcriterion. • Also, pairwise comparisons are needed for each set of subcriteria.
MULTI-LEVEL HIERARCHIES • Another important point is that all items on the same level should be within one order of magnitude of importance. • For example, NPV might be more than ten times more important than initial market size and appear one level above initial market size. • However, all market criteria taken together might be comparable to NPV and appear on the same level.
MULTI-LEVEL HIERARCHIES • We now display two additional examples of multi-levels hierarchies using Expert Choice. • Both are based on student projects. • They appear in files VENDOR.AHP and SITE.AHP. • Others are found in the “samples” folder in Expert Choice.
RATINGS: Background • Multilevel hierarchies are needed when there are many criteria - but what happens if we have many alternatives? • The ratings approach is used when there are a large number of alternatives to be evaluated. • For example, if there are 50 employees to be evaluated, then 1,225 (50(49)/2) pairwise comparisons would be required for each criterion!
RATINGS: Background • It is impractical to make that many alternative pairwise comparisons. • The ratings approach requires setting up a ratings scale under each criterion. • For example, in evaluating an employee’s organizational skills, a manager could rate the employee as either Excellent, Very Good, Good, Fair, or Poor.
RATINGS: Background • It is crucial to define what Excellent means and how it is attained. • Pairwise comparisons are needed to determine the relative importance of each ratings scale category (intensity). • For example, with respect to the organizational skills criterion, how much better is an Excellent rating compared to a Very Good rating?
RATINGS: Background • The answer to this question might be different if we changed the criterion from organizational skills to implementation skills. • In fact, you may decide to use different intensities for each criterion. • It is important to understand that alternatives are not pairwise compared in a rating model, rather alternatives are rated for each criterion.
RATINGS: Background • Ratings models are a part of everyday life. • Assigning grades to any course is a ratings exercise. • Since an A is assigned a score of 4.00 and a C is assigned a score of 2.00, it follows that an A is twice as good as a C. • We never met a student who agreed with this! Do you?
RATINGS: Background • Consider the following example. • Although a 91 is only two points higher than an 89, assigning an A to the 91 and a B to the 89 means that the 91 is really 1.33 (4.00/3.00) times better than the 89. • These and other problems are discussed at the Expert Choice web site (www.expertchoice.com) under Annie Person.
RATINGS: Background • Many organizations use ratings or scoring models for evaluation. • For example, in evaluating carpet suppliers, a company might assign the values 3, 1, 2 for cost, support, and quality, respectively. • Typically, they assign 5, 4, 3, 2, and 1 to ratings of excellent, very good, good, fair, and poor, respectively.
RATINGS: Background • Suppose supplier A is judged to be good in cost, excellent is support, and good in quality. • Supplier A’s score would be 3*3+1*5+2*3=20. • Assume that supplier B is judged to be excellent in cost, fair in support, and very good in quality. • Supplier B’s score would be: 3*5+1*2+2*4=25.
RATINGS: Background • Can we say that supplier B is 25% better than supplier A? • Absolutely not! The numbers assigned as criteria weights and as intensity weights are not necessarily ratio-scaled. • Ratio-scaled comparisons, such as dividing supplier total scores are meaningless in such cases.
RATINGS: Background • Ratio-scaled measurement assumes, for example, that cost is 3 times (3/1) more important than support, and that an excellent rating is 1.25 times (5/4) better than a very good rating for each criterion. • This is rarely, if ever, the case for such scoring systems! • The AHP is preferred because it applies ratio-scale measurement throughout the evaluation process.
EXPERT CHOICE: Ratings • Goal and criteria (and possibly subcriteria) are entered in a ratings model in the same fashion they were entered in standard AHP. • Criteria (and possible subcriteria) pairwise comparisons are next performed. • Next, select the Data Grid button (looks like a spreadsheet). • Highlight a cell in the first criteria column and select the Formula Type and Ratings commands.
EXPERT CHOICE: Ratings • Enter each rating scale intensity (for example, excellent, very good, good, fair, and poor) in the Intensity Name column. • When finished select the Assess command. • You can now enter the pairwise comparisons for the rating scale intensities. • After recording judgments, select the Close command.
EXPERT CHOICE: Ratings • If the rating scale intensities and their pairwise comparisons are not the same for all criteria, highlight a cell in the second criteria column and repeat the process. • If the intensities and pairwise comparisons are the same for all criteria, then select the Formulas Grid button (looks like Y=f(x)). • (If this button does not appear, select the Model View button and then the Data Grid button.)
EXPERT CHOICE: Ratings • To copy the intensities and pairwise comparisons (from criterion 1) to other criteria (criteria 2 and 3), highlight the Ratings cell in the Type column of criterion 1 and select the Edit and Copy Formula commands. • Next, highlight the Ratings cells for criteria 2 and 3 and select the Edit and Paste Formula commands. • You have now copied all of the ratings intensities and their pairwise comparisons from criterion 1 to criteria 2 and 3.
EXPERT CHOICE: Ratings • Select the Data Grid button and you are ready to enter the alternatives. • Remember that alternatives are NOT entered in the hierarchy. • Highlight the first cell in the Alternative column and enter each alternative in turn. • When finished, highlight the cell corresponding to the first alternative (row 1) and the first criterion (column 1).
EXPERT CHOICE: Ratings • Select the desired rating scale intensity and repeat for all criteria for all alternatives. • For a given alternative (row), as the user highlights each criterion (column), the appropriate intensities appear and the user selects the desired one. • The final step is to select the View and Totals column commands to see the final scores for each alternative. • To sort, highlight any final weight and select the Edit and Sort, Descending commands.
EXPERT CHOICE: Ratings • Criterion intensity scores are computed similarly to ideal synthesis without the normalization step. • First, all intensity weights are divided by the largest intensity weight. • Second, the adjusted intensity weight selected by the user is multiplied by the criteria weight and the results added to the total score.
EXPERT CHOICE: Ratings • An AHP ratings model for our carpet supplier problem is in a file called CARPET.AHP. • The local weights for each rating scale intensity are: 0.419, 0.263, 0.160, 0.097, and 0.062. • Dividing by 0.419 yields adjusted weights of: 1.000, 0.627, 0.382, 0.232, and 0.148. • For example, if we select a good rating for cost, then 0.382 times the cost weight of 0.558 or 0.213 is added to the total score.
EXPERT CHOICE: Ratings • Another example of a ratings model with subcriteria appears in EMPEVAL.AHP. • This model is based on a student project which utilized the actual factors in an employee evaluation system. • Others are found in the “samples” folder in Expert Choice.
GROUP DECISION MAKING • How did the couple arrive at their combined judgments in the original car evaluation problem? • There are many ways of applying AHP to support a group decision-making process. • For example, all of the parties discuss, debate, and eventually agree on each pairwise comparison entry.
GROUP DECISION MAKING • Alternatively, each individual provides their own judgments in separate copies of the model. • These results could be summarized and used as a basis to reach consensus. • Another approach is to create a hierarchy with goal, participants, criteria, and alternatives. • Pairwise comparisons can determine each participants weight in the process.
GROUP DECISION MAKING • One last approach is to achieve consensus mathematically. • Each participant provides their own judgments for each pairwise comparison and the results must be averaged. • For example, suppose two individuals compared cost to safety and provide judgments of 9 and 1/9.
GROUP DECISION MAKING • The arithmetic mean is 4.56 ((9+(1/9))/2). Do you think this is the best estimate? • Probably not! Since both judgments are at opposite ends of scale, we would expect the combined judgment to be 1.00. • The geometric mean produces this result. • In general, if there are n individuals that provide judgments, the geometric mean is defined as the nth root of the product of the n judgments.
GROUP DECISION MAKING • As another example, in comparing cost to safety suppose the judgments of three individuals are 2, 4, and 8. • The geometric mean is the cube root of their product (64) which is 4. • Expert Choice manages the entire group decision making process and achieves consensus mathematically by computing the geometric mean.
GROUP DECISION MAKING • First, create a hierarchy as described earlier. • Tell Expert Choice that this is a group model by selecting the Go and Participant Table commands. • Next, select Edit and Group Enable, followed by Edit,Add N Participants, and enter the number of participants. • Click on a participant to change the name, enter any demographic data, and select File and Close.
GROUP DECISION MAKING • At this point, there are N participants and a facilitator. • The facilitator acts as the leader and may also enter judgments, if desired. • When a group model is opened, you must respond with either the facilitators name (you have access to all information) or the name of one of the participants (you only have access to that participant’s information).
GROUP DECISION MAKING • The facilitator can enter pairwise comparisons for all participants. • Select a participant from the Participants drop-down list on the toolbar (under the Go command). • Choose a pairwise comparison mode and enter the judgments for the participant. • Record the judgments when finished and repeat for all parts of the hierarchy and for all participants.
GROUP DECISION MAKING • After all pairwise comparisons have been entered for all participants, the judgments are combined. • This is accomplished by selecting Combined from the Participants drop-down list. • Next, select Edit, Combine Participants Judgments/Data, Entire Hierarchy, and Both. • This will combine judgments by computing all necessary geometric means.
BUILDING LARGER MODELS • Useful Expert Choice features • File, Print Preview, File, Save as Word Document commands creates a Word file of the entire hierarchy. Use Options and Printing commands to select desired output. • Drop and drag features are useful when developing the hierarchy. • To get information from Word to Expert Choice use the Edit, Paste Children from Clipboard commands. This is useful if developing the hierarchy while brainstorming in Word.
BUILDING LARGER MODELS • Lessons that we have learned about AHP. • Have experts develop their part of the hierarchy. • Develop hierarchy iteratively over several sessions. • An alternate approach is to only develop a benefits hierarchy. The benefits alternative weights could be used in a cost/benefit analysis. • You could also have a benefits hierarchy and a cost hierarchy.
BUILDING LARGER MODELS • Lessons that we have learned about AHP. • Rank alternatives or criteria before performing pairwise comparisons. This helps consistency. • Many people are comfortable with graphical mode of pairwise comparison. • After entering pairwise comparisons, Expert Choice displays a graphical representation of the weights. The user can move these bars if necessary. Expert Choice computes the corresponding pairwise comparisons that yield these weights.
SUMMARY • In this module: • we provided an overview of classical decision analysis; and • offered the AHP as an alternative decision-making process.
SUMMARY • AHP benefits include: • natural way to elicit judgments; • measure degree of inconsistency; • easy to use; • allows broad participation; and • fully supported by Expert Choice.