Analytic Hierarchy Process ( AHP )
Analytic Hierarchy Process ( AHP ). Analytic Hierarchy Process (AHP ) I s one of Multi Criteria decision making method that was originally developed by Prof. Thomas L. Saaty .

Analytic Hierarchy Process ( AHP )
E N D
Presentation Transcript
Analytic Hierarchy Process (AHP) BasmahALQadheeb-2012
Analytic Hierarchy Process (AHP) • Is one of Multi Criteria decision making method that was originally developed by Prof. Thomas L. Saaty. • Is an excellent modeling structure for representing multicriteria(multiple goals, multiple objectives) problems—with sets of criteria and alternatives (choices)- commonly found in business environments. • In short, it is a method to derive ratio scales from paired comparisons BasmahALQadheeb-2012
level0 level1 level2 BasmahALQadheeb-2012
Level 0 is the goal of the analysis. Level 1 is multi criteria that consist of several factors . Level 2 in is the alternative choices. • The input of AHP can be obtained from actual measurement such as price, weight etc., or from subjective opinion such as satisfaction feelings and preference. • AHP allow some small inconsistency in judgment because human is not always consistent. BasmahALQadheeb-2012
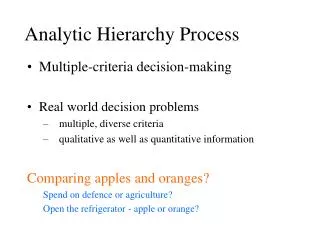
Pair-Wise Comparison Now let me explain what paired comparison is • Suppose we have two fruits Apple and Banana. I would like to ask you, which fruit you like better than the other and how much you like it in comparison with the other BasmahALQadheeb-2012
. Let us make a relative scale to measure how much you like the fruit on the left (Apple) compared to the fruit on the right (Banana). For instance I strongly favor banana to apple then I give mark like this • Researchers have confirmed the 9-unit scale as a reasonable basis for discriminating between the preferences for two items. BasmahALQadheeb-2012
Now suppose you have three choices of fruits. Then the pair wise comparison goes as the following You may observe that the number of comparisons is a combination of the number of things to be compared. Since we have 3 objects (Apple, Banana and Cheery), we have 3 comparisons. BasmahALQadheeb-2012
Table below shows the number of comparisons. BasmahALQadheeb-2012
Example of Analytic Hierarchy Process For example John has 3 kinds of fruits to be compared BasmahALQadheeb-2012
In level 1 you will have one comparison matrix corresponds to pair-wise comparisons between 3 factors with respect to the goal. Thus, the comparison matrix of level 1 has size of 3 by 3. BasmahALQadheeb-2012
Making Comparison Matrix • We have 3 by 3 matrix • The diagonal elements of the matrix are always 1 and we only need to fill up the upper triangular matrix. • How to fill up the upper triangular matrix is using the following rules: • If the judgment value is on the left side of 1, we put the actual judgment value. • If the judgment value is on the right side of 1, we put the reciprocal value . BasmahALQadheeb-2012
John made subjective judgment on which fruit he likes best, like the following BasmahALQadheeb-2012
Comparing apple and banana, John slightly favor banana, thus we put 1/3 in the row 1 column 2 of the matrix. • Comparing Apple and Cherry, John strongly likes apple, thus we put actual judgment 5 on the first row, last column of the matrix. • Comparing banana and cherry, banana is dominant. Thus we put his actual judgment on the second row, last column of the matrix. Then based on his preference values above, we have a reciprocal matrix like this BasmahALQadheeb-2012
Priority Vector • The priority vector shows relative weights among the things that we compare. • Suppose we have 3 by 3 reciprocal matrix from paired comparison BasmahALQadheeb-2012
We sum each column of the reciprocal matrix to get BasmahALQadheeb-2012
Then we divide each element of the matrix with the sum of its column, we have normalized relative weight. The sum of each column is 1. BasmahALQadheeb-2012
The normalized principal Eigen vector can be obtained by averaging across the rows The normalized principal Eigen vector is also called priority vector BasmahALQadheeb-2012
In our example above, Apple is 28.28%, Banana is 64.34% and Cherry is 7.38%. John most preferable fruit is Banana, followed by Apple and Cheery BasmahALQadheeb-2012