Population Growth
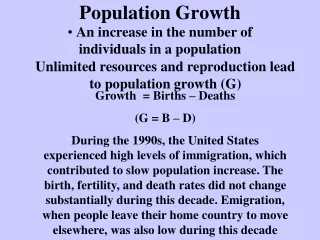
Population Growth. A population is…. A group of organisms, of the same species, that live in the same location. Ex: population of frogs in Lums Pond Ex; population of bacteria in a mouth Ex: human population of Delaware. Biotic Potential.

Population Growth
E N D
Presentation Transcript
A population is…. • A group of organisms, of the same species, that live in the same location. • Ex: population of frogs in Lums Pond • Ex; population of bacteria in a mouth • Ex: human population of Delaware
Biotic Potential • The highest rate of reproduction under ideal conditions • Ex: a fly’s biotic potential is 900. • Ex: a human’s biotic potential is 68 children.
The number of individuals in a given area . (Ex: 22 students/classroom or 18 people/phone booth) Population Density
Calculating Population Density Population Density Number of Individuals = Unit Area Example: Suppose you counted 200 Oak trees in a 100 acre area. What is the population density? Answer : 200 oaks/100 acres or 2 oaks/1 acre
Question • If both Wilmington and Milton are considered the same size area, which would have the higher Population Density?
Three basic patterns for a population’s growth • Linear growth • Exponential growth • Logistic growth
Linear Growth • Growth that occurs at a constant rate would be considered linear growth • Example: If my hair grows .25 inches every week, then in one month my hair grows 1 inch, in two months it grow two inches, and in three months it grows three inches
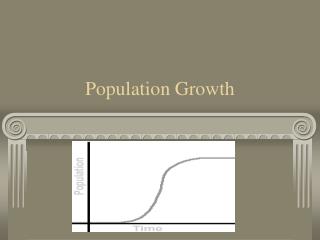
Exponential Growth • Describe what it means by looking at the graph. • Starts out slowly…takes a long time to build up and then it has a rapid increase. • Current world populations is approximately is over 7.2 Billion since October 2013.
Logistic Growth • What does it mean according the graph pattern? • The population grows exponentially until limiting factors halt population growth and things eventually start to die out.
No population can grow forever: • Growth stops when the population reaches its CARRYING CAPACITY • The maximum number of individuals that an environment can support! • Scientists estimate the world’s carrying capacity for humans to be around 8.5-10 billion people.
Birth Rate Number of births in a given amount of time Ex: US birth rate is 14.16/1000 people Death Rate Number of deaths in a given amount of time Ex US death rate is 8.27/1000 people Population Growth Depends on 2 Things
Predator and Prey relationship • As the population of prey increases ( ), the predator population ( ) begins to follow it. • As prey populations begin to decrease ( ), the predator populations begin to decrease ( ).
Whooping Cranes (Grus americana) are the tallest birds in North America. They stand about 1.6 metres tall and have a wingspan of two metres. Beginning in the 1900s the Whooping Crane population began to decline as wetland habitat was drained for farmland and as birds were shot. By 1941, only 16 birds survived and shortly after this a concerted conservation efforts by Canada and the United States began. This effort has succeeded in increasing the population to about 180 birds by 1999. Distribution
1. Which type of graph represents human population growth? • Exponential • Linear • Logistic (S curve) • parabola
2. The most accurate way to determine population size. This is where they count every organism. • Sampling • Indirect observation • Mark and recapture • Direct observation
3. The largest population an area can support. • Biodiversity • Biotic potential • Carrying capacity • Limiting factors
4. When an organism leaves a population • Immigration • Emigration • Death rate • Birth rate
5. An environmental factor that causes a population to decrease.. Ex. Lack of water. • Environmental factor • Limiting factor • Carrying capacity • community
6. The number of births in a certain amount of time. • Birth rate • Baby rate • Death rate • Marriage rate
7. When you move into a population • Emigration • Immigration • Sampling • Mark and recapture
8. The highest rate of reproduction under ideal conditions • Carrying potential • Biotic potential • Reproduction potential • Baby making potential
9. If the birth rate exceeds the death rate the population will: • Increase • Decrease • Stay the same • immigrate
10. Counting signs of organisms (like their home) then determining their population size. • Observation • Indirect observation • Direct observation • sampling
11. Scientist capture a group of organisms and mark them without causing harm and release them. Later they capture more and compare the amount of marked vs. unmarked species to calculate a population. • Random sampling • Mark and recapture • Reassigned sampling • Direct observation
12. What is the approximate current population of the world? • 6.9 million • 6.9 billion • 9.6 million • 9.6 billion
13. On a population graph who would have the higher population? • Prey • Predators • Smiles • Sunshine and rainbows
14. What is the population density of oak trees in Ms. S’s backyard. There are 10 oak trees in 20 square meters. • 200 oak trees per square meter • .5 oak trees per square meter • 2 oak trees per square meter
15. Ms. S counts the amount of poison ivy in a 1 meter radius. She then multiplies it by her yard of 20 square meters. This is an example of: • Mark and recapture • Direct observation • Indirect observation • sampling
16. If there are 40 poison ivy plants in a 1 meter radius, how many poison ivy plants are there in her 20 square meter yard? • 800 plants • 80 plants • 600 plants • 60 plants
17. Limiting factors of population size are: • Predators, disease, birth rate, death rate • Food, water, space, weather • Food, carrying capacity, disease, immigration
18. What historical event led to a huge increase in the world population? • World War 1 • Dust Bowl • War on Terrorism • Industrial Revolution
19. What happens when the rabbit population increases • The amount of fox increase. • The amount of fox decrease • The amount of fox stays the same.
20. Why is the population of rabbits more than the population of fox? • Rabbits are lower on the food chain so there is more of them in the energy pyramid. • It is because of where they calculated this data from had less fox. • As you move up the food chain the easier it is to obtain energy.