Download
1 / 27
270 likes | 297 Vues
Discover the new dynamics of core-collapse supernova shock waves through advanced computing. From historical breakthroughs to modern models, explore the challenges and advancements in spherical symmetry breaking, SASI discovery, and the need for 3D modeling. Dive into the hurdles of large-scale 3D simulations and the importance of interactive data access and visualization in scientific discovery.

E N D
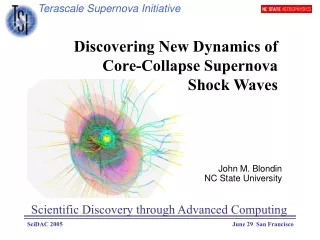
Terascale Supernova Initiative Discovering New Dynamics of Core-Collapse Supernova Shock Waves John M. Blondin NC State University Scientific Discovery through Advanced Computing
A Long History of Computational Physics… • 1966 Colgate and White Neutrino-Driven prompt explosion • 1985 Bethe and Wilson Shock reheating via neutrino energy deposition • 1992 Herant, Benz, and Colgate Convective instability above neutrino-sphere
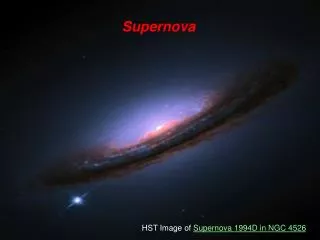
First generation of 2D SN models hinted at a low-order asymmetry in the shock wave at late times (100’s of msec after bounce). Burrows, Hayes & Fryxell 1995
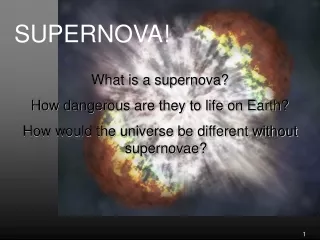
Dynamics of the Supernova Shock Wave When, Where and How is spherical symmetry is broken?
SN Code Verification Houck and Chevalier 1992 Blondin and Mezzacappa 2005 This post-bounce model provides an opportunity to verify supernova codes against the results of a linear perturbation analysis.
SASI Standing pressure waves within the cavity of a spherical accretion shock are amplified with each oscillation. The shock becomes significantly distorted after only a few periods. In core-collapse supernovae, SASI will operate in conjunction (competition?) with neutrino-driven convection.
Must move to 3D! This initial SASI discovery with axisymmetric 2D simulations pointed to the obvious need for models in full 3D. To better understand the challenges of 3D, let us first look at the process of discovery for the initial 2D models.
Hurdles for Large-Scale 3D Not a problem Simulation code Floating points Data output Data transport Visualization and analysis Thank you DOE It works Does not work I can’t see!
First Results: SASI Exists in 3D • 3D Cartesian grid • 100 Million zones • 100’s of processors • 100’s of GB in full run With data stuck on the West Coast, this was science in the dark!
Shared file system Cray X1 Billion-cell simulation in 30 hours generates 4 terabytes Visualization platform Science Begins with Data Scientific discovery is done with interactive access to data. • Must have interactive access on a large-memory computer for analysis and visualization. • Must have high bandwidth in accessing the data. • Must have sufficient storage to hold data for weeks/months.
Interactive Visualization of TB Datasets A commodity linux cluster provides all the ‘must haves.’ Data is sliced into slabs and stored on local disks on the cluster nodes. EnSight Gold provides an easy visualization solution, including remote client-server operation and collaboration.
We have jumped the hurdle, but there is much more to be gained. Current research in scientific visualization is providing glimpses of very powerful new techniques. The next step is to get these tools into the hands of application scientists so they can explore their data.
Data Flow Continues to Evolve Logistical Network Analysis Cluster Supercomputer (flops) (interactive) Parallel analysis and vis on distributed data Run Simulation On 100’s to 1000’s of cpus
Forecast looks challenging • Current ‘full physics’ models in 2 spatial dimensions (2562 ) produce 70 GB per run. • Current ‘limited physics’ models in 3 spatial dimensions (10003) produce 4 TB per run. • We know this problem must be attacked in 3D with accurate nuclear physics and neutrino transport. With advances in code development and computing platforms, we are looking at PB datasets in the near future!