Demand Theory
280 likes | 589 Vues
Demand Theory . Chapter 3. A. Demand. 1.Demand analysis is important for:. determining the potential for introducing new products understanding the impact of change in the prices of competing products assessing the impact of advertising on the volume of sales

Demand Theory
E N D
Presentation Transcript
Demand Theory Chapter 3
1.Demand analysis is important for: • determining the potential for introducing new products • understanding the impact of change in the prices of competing products • assessing the impact of advertising on the volume of sales • aiding in forecasting sales and revenues • providing the insights necessary for effective management of demand
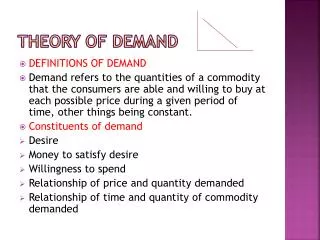
2a. Definition Demand schedule (curve, function) • the quantities that consumers are willing and able to buy at different prices during a given period of time, ceteris paribus. "effective demand"- "willing and ability"
The market demand Schedule and curve Shows the total quantity of the good that would be purchased at each price Price 2000 D-Curve 1000 Q 800 1500
3a. Law of demand • The law of demand refers to the inverse price- quantity relationship. 3b. Justifications of the law of demand • Substitution effect • Income effect • Law Diminishing Marginal Utility (LDMU)
Substitution effect – When the price of one of substitute goods rises, its quantity demanded decreases because consumers will shift cheaper substitutes. If Pcoke rises, Qcoke will decrease and the demand for Pepsi will increase. • Income effect – When the price of a good rises, its quantity demanded decreases because consumers’ income is fixed. Illustrate.
Some exceptions to the law of demand • Giffen good case - good whose quantity demanded increases as its price rises. • "bandwagon effect" - people sometimes demand a commodity because others are purchasing it ( to be "fashionable" or "Keep up with the Jones") • “Snob effect" - occurs as some consumers seek to be different by buying most expensive items (conspicuous consumption)
4a. change in quantity demanded refers to a movement on the same demand curve due to a change in the product price: Q=f(p, others constant) b. change in demand refers to a shift in the whole demand curve due to factors other than change in the product price.
5. Determinants (shifters) of Demand • change in the price of related goods substitutes If Pcoke, DPepsi complements If Pcamera, DFilms • change in consumers’ income normal goods As income, D New Cars inferior goods As income, D used cars • change in the expected price of a good in the future If price of homes is expected , D • change in tastes and preferences (cigarettes, diet food) favorable change in taste D, and vise-versa • The number of potential consumers (population)
6 It is the market demand (not the individual demand) and market supply that determine the market price for goods and services.
B. Price Elasticity of Demand (1a) Ep • the responsiveness of qt. demanded to a given percentage change in price. Ep =
(1b) Example • If an increase in tuition by 10% results in a decrease in college enrollment by only 4% in Tennessee, what is the Ep for higher education in TN? Ep = = -.04/.10= -.4 < 1 inealstic • MTA raises the price of bus ride by 5% and the population of bus riders decreases by 10%. Ep = -.10/.05 = 2 > 1 and the demand for bus ride is price elastic, or sensitive to fare hike.
(2a) Point Price Elasticity of Ep = (see, #4 Handout ) (2b) Computing demand elasticity using the "average" or "arc" elasticity formula ( See, class exercises # 1)
Ranges of Ep based on the numerical value • Elastic demand if EP > 1 • Inelastic demand if Ep < 1 • Unit elastic demand if Ep = 1 • Perfectly elastic demand if Ep= ∞ • Perfectly inelastic demand if Ep = 0 Interpretation of Ep = -1.5 ?
Given the information below, determine the price of demand for Midlander yearbook. YearPriceQuantityTREP 1987 $13.50 2100 28350 1988 15.00 1950 29250 -.7 Ep = -.7 < 1 The demand for Midlander yearbook is price inelastic over the given price range. Interpret the meaning of Ep = -.7
(4a) Relationship of Ep and TR p. 147 PriceQuantityTotal RevenueEp 1.00 100,000 $100,000 0.50 300,000 150,000 1.5 elastic 0.25 600,000 150,000 1.0 unit elastic 0.10 1,000,000 100,000 0.58 inelastic
(4b) Generalizations • If the demand for a good is elastic, then lowering(raising) the price will increase (decrease) total revenue (expenditures) • If the demand for a good is unit elastic, then lowering or raising the price will not change the total revenue. • If the demand for a good is inelastic, then lowering(raising) will lower (increase) the total revenue.
(5) Determinants of Price Elasticity • The percentage of consumers' income spent on the good or service=> larger % of income => more elastic generally • The number of substitutes available for the commodity. More substitutes more elastic • Narrow versus broad definition of goods(ice cream vs food); Narrow definition more elastic; Broad less elastic • Time period (short-run vs. long-run) less elastic in the short-run and more elastic in the long-run
(6) Real World Applications of Ep a. It can be used for pricing strategy b. It can be used in public utilities rate regulation. c. It can be used for market structure studies.
C. Income Elasticity of Demand (1a) EI = a measure of the responsiveness of quantity demanded as a result of a given percentage change in income. EI=%ΔQ/% ΔI (1b) Examples - Increases in single-family home purchases as consumers' income rise - Increase in the percent of vacation travelers as their income rises.
(2a) Point income elasticity EI = = = (2b) Arc Income Elasticity (or average) EI =[ ] = x (I1+I2)/(Q1+Q2) (3) EI > 0normal good; EI < 0inferior (See class exercise #2)
D. Cross P. Elasticity of Demand 1a) The cross- elasticity of demand for commodity x with respect to the price of commodity y (Exy) measure the percentage change in demand for x as a result of a given percentage change in the price of commodity y. Exy = (1b)Examples =(ΔQx/ΔPy)(Py/Qx)
(2a) Point Exy = = (2b) Arc Exy = (3) When Exy > 0, =>x and y are substitutes When Exy < 0, x and y are complements