STT430/530: Nonparametric Statistics
290 likes | 503 Vues
STT430/530: Nonparametric Statistics. Chapter 2: Fundamentals Of Nonparametric Methods Dr. Cuixian Chen. Ch2: Fundamentals of nonparametric methods, permutation test1. We want to justify an claim about median, with no further assumptions on the distribution of the data.

STT430/530: Nonparametric Statistics
E N D
Presentation Transcript
STT430/530:Nonparametric Statistics Chapter 2: Fundamentals Of Nonparametric Methods Dr. Cuixian Chen
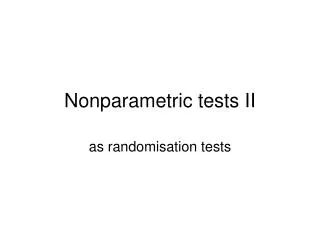
Ch2: Fundamentals of nonparametric methods, permutation test1. • We want to justify an claim about median, with no further assumptions on the distribution of the data. • Example: 2 out of 5 students in a math contest are from the test maker’s class. If the two students scored top two, shall we suspect that the two students benefit from test maker’s class? • Steps for the hypothesis testing? (Consider both permutation and combination) What properties can you find for these two relative frequency distributions?
Bar graph for both data sets from permutation and combination • What properties can you find for these two bar graphs?
Permutation in R ## This only works for ## selecting 2 items from ## n items with TWO loops x=NULL; n=5; r=2; for (i in 1:(n-1)) { for (j in (i+1):n) x=rbind(x,c(i, j)) } cbind(x,rowSums(x)) table(rowSums(x)) ## If you need to select 3 ## items from n items, ## then you need to have ## THREE loops! ## Make a function called ## “permutations” permutations<-function(n, r) { for (i in 1:(n-1)) { for (j in (i+1):n) x=rbind(x,c(i, j)) } return(x); } ## Call the function “permutations” x=NULL; x<-permutations(n=5,r=2) cbind(x,rowSums(x)) table(rowSums(x))
Ch2: Fundamentals of nonparametric methods, permutation test2 • We want to justify a claim about median, while making no further assumptions on the distribution of the data. • Example2.1: four from nine patients are selected at random(equal likely) to receive a new drug. After three weeks all nine patients are examined by a skilled consultant who, on the basis of various tests and clinical observations ‘ranks’ the patients’ conditions in order from least severe (rank 1) to most severe (rank 9).
Ch2: Fundamentals of nonparametric methods, permutation test2 • Eg 2.1: four from nine patients are selected at random to receive a new drug. After three weeks all nine patients are examined by a skilled consultant who, on the basis of various tests and clinical observations ‘ranks’ the patients’ conditions in order from least severe (rank 1) to most severe (rank 9). Q1: If we assume that there is no beneficial effect of the new drug, what is the probability that the patients who received the new drug are ranked 1, 2, 3, 4? Q2: If we do observe patients receiving ranks 1,2,3,4, shall we claim that the drug has an effect (beneficial or deleterious)? H0: new drug has no effect v.s. Ha: new drug has an effect (beneficial or deleterious)
Ch2: Fundamentals of nonparametric methods, permutation test2 • Eg 2.1: four from nine patients are selected at random to receive a new drug. After three weeks all nine patients are examined by a skilled consultant who, on the basis of various tests and clinical observations ‘ranks’ the patients’ conditions in order from least severe (rank 1) to most severe (rank 9). • Q3: What if the ranks are 1,2,3,9, shall we claim that the drug has an effect? • Q4: For what possible sum of ranks such that drug has an effect?
Ch2: Fundamentals of nonparametric methods, permutation test2 • Def: Tests based on permutation of ranks or on permutation of certain functions of ranks are called permutation tests or randomization tests. • The permutation gives all possible assignments. • Only convenient when we have a small sample size. • When sample size is large, the computation could be very heavy.
Ch2 Fundamentals of nonparametric methods , an introduction to R • Introducing R. • Where to find? Google “R”->the first link. • Download and install CRAN package. • Then we have • How do we use it? • Assign value to a variable x: x=3; or x<-3; • A sequence of numbers: 1:5; or 6:3; • A vector: x=c(4,5,6); or x=4:6; , then x[2]=5. • loop: for (i in 1:5) {print(i)}; Eg: find the sum of 1 to 10 using loop. • Average: mean(x); • sum: sum(x); • Find the 5-# summary: summary(x); • For more information on R: link1; link2
Ch2 Fundamentals of nonparametric methods, --- review of Binomial distribution from STT315 • Def 3.6: Binomial experiment: The number of successes in n independent trials, with each trial having probability of success p and probability of failure q (= 1-p). 1. Each trial is called a Bernoulli trial. 2. Experiment consists of n repeated trials. 3. Two possible outcomes, called success or failure. 4. P(success) = p, constant from trial to trial. 5. Each trial is independent. • Def 3.7: The probability distribution of the binomial r.v. X, the number of successes in n independent trials (or its prob mass function), is Eg: Suppose that a large lot of electrical fuses contains 5% defectives. If a sample of five fuses is tested, find the probability of observing at least one defective. In R, use any of these: 1-0.95^5 1-dbinom(0, 5, 0.05) 1-pbinom(0, 5, 0.05)
Ch2: Fundamentals of nonparametric methods, Binomial dist in R • Type help(rbinom) or ? rbinomin R, then the help files will popup. • Suppose we have n ind. trials and p as the success prob in each trial. • dbinom(x, n, p) is P(X=x) • pbinom(x, n, p) is P(X≤x). • qbinom(per, n, p) is at which point x, such that P(X≤x)=per. • rbinom(N, n, p) generates N binomial experiments, and the generated N numbers represent the count of successes among the experiments. Eg: Let X be a random variable such that X~ Bin(10,0.2), that is: n=10, p=0.2. With R, find the following items • Pr(X=4); • Pr(X<=4); • Pr(X>6); • Find x, such that Pr(X<=x)=0.8791 • Find x, such that Pr(X>x)=0.00637
Ch2: Fundamentals of nonparametric methods, Binomial Test(sign test) Introduction to Binomial Test (Sign Test): Eg2.2: In medical studies the progress of patients is often monitored for a limited time after treatment; often anything from a few months to 5 or 6 years. Dinse (1982) gives data for survival times in weeks for 10 patients with symptomatic lympho- cytic non-Hodgkin’s lymphoma. The precise survival time is not known for one patient who was alive after 362 weeks. The observation for that patient is said to be censored. Survival times in weeks were 49, 58, 75, 110, 112, 132, 151, 276, 281, 362* The asterisk denotes a censored observation. Q: Is it reasonable to suppose that these data are consistent with a median survival time of 200 weeks?
Ch2: Fundamentals of nonparametric methods, Binomial Test(sign test) Eg2.2: … Survival times in weeks were 49, 58, 75, 110, 112, 132, 151, 276, 281, 362* The asterisk denotes a censored observation. Q: Is it reasonable to suppose that these data are consistent with a median survival time of 200 weeks? Ideas: Let ϴ=median of survival time for the population. That is: testing ϴ=200. A simple test needs only a count of the # of sample values exceedingϴ=200 (recording as a “plus” sign). By definition of random sample and population median, if we have a sample from any continuous distribution with median 200, each sample value is equal likely to be above or below median of 200. Let X=# of plus signs in 10 observations, p=0.5, then X~Bin(n=10, p=0.5).
Ch2: Fundamentals of nonparametric methods, Binomial Test(sign test) Eg2.2: … Survival times in weeks were 49, 58, 75, 110, 112, 132, 151, 276, 281, 362* The asterisk denotes a censored observation. Q: Is it reasonable to suppose that these data are consistent with a median survival time of 200 weeks? • Null and Alternative hypothesis? • What is median and what does 50/50 indicate? • how do we find the p-value? (pbinom?) We find 3 plus signs. For a two-sided test, p-value is the Prob of 2-ends. P-value=Pr(X<=3)+Pr(Y>=7) =2*Pr(X<=3) = 2* pbinom(3, 10, 0.5) =2*0.1719 = 0.3438 (by symmetric).
Ch2: Fundamentals of nonparametric methods, Binomial Test in R x<-c(49, 58, 75, 110, 112, 132, 151, 276, 281, 362); ######## method1 num.success<-sum(x>200); binom.test(num.success,length(x)) # default is two-sided test ######## method2 2*pbinom(num.success,length(x),prob=0.5) For more info about binom.test in R, please check: http://stat.ethz.ch/R-manual/R-patched/library/stats/html/binom.test.html Description Performs an exact test of a simple H0 about the probability of success in a Bernoulli experiment. Usage binom.test(x, n, p = 0.5, alternative = c("two.sided", "less", "greater"), conf.level = 0.95)
Ch2: Fundamentals of nonparametric methods, Binomial Test in SAS /*Use Proc Univariate*/ Data example2_2; input surv; cards; 49 58 75 110 112 132 151 276 281 362 ; procunivariate data=example2_2 mu0=200; var surv; histogram / normal (mu=est sigma=est); qqplot /normal (mu=est sigma=est); run; /*Use Proc Freq*/ Data example2_2; input surv; cards; 1 1 1 1 1 1 1 0 0 0 ; procfreq data = example2_2; tables surv / binomial(p=.5); exact binomial; run; Note: For PROC FREQ, the Exact confidence limit is about category of 0, not 1.
Ch2: Fundamentals of nonparametric methods, Binomial Test Eg5: A random sample of 16 customers of each category was interviewed regarding their perceptions of the bank's service quality. Original data: 79,85,86,80,40,55,60,55,75,65,38,60,70,63,73,75. Sorted observations are 38, 40, 55, 55, 60, 60, 63, 65, 70, 73, 75, 75, 79, 80, 85, 86 Q: May we claim that the median is around 50? Eg6: What if we change the first 4 of ORIGINAL observations in Eg5 to 100, 100, 100, and 100? Eg7: In a blind taste test, 45 coffee drinkers sampled fresh-brewed coffee versus a gourmet instant coffee. When stating their preferences, 19 chose the instant and 26 chose the fresh-brewed. Test the claim that coffee drinkers tend to prefer fresh-brewed coffee.
Ch2: Fundamentals of nonparametric methods, Binomial Test in R #################### Ch2: the binom test ######################## ## Example 5 ## x<-c(79,85,86,80,40,55,60,55,75,65,38,60,70,63,73,75); ######## method1 num.success<-sum(x>50); binom.test(num.success,length(x)) ######## method2 2*(1-pbinom((num.success-1),length(x),prob=0.5)) #################### Ch2: the binom test ######################## ## Example 6 ## x<-c(100, 100, 100, 100,40,55,60,55,75,65,38,60,70,63,73,75); ######## method1 num.success<-sum(x>50); binom.test(num.success,length(x)) ######## method2 2*(1-pbinom((num.success-1),length(x),prob=0.5)) #################### Ch2: the binom test ######################## ## Example 7 ## x<-c(rep(0,19), rep(1,26)); ######## method1 num.success<-sum(x>=1); binom.test(num.success,length(x),alternative = "greater") ######## method2 1-pbinom((num.success-1),length(x),prob=0.5)
Ch2: Fundamentals of nonparametric methods, Binomial Test Summary • Recall: By definition of random sample and population median, if we have a sample from any continuous distribution with median ϴ, each sample value is equal likely to be above or below median of ϴ. • Binomial or sign test only cares observations’ relative direction to the claimed value and all it needs is the proportion (above/below the claimed value). • Binomial test or sign test is a nonparametric method. • Q: what is major difference between Binomial test and permutation test • Binomial test does not involve as many computation time as permutation test. • Permutation test focus on the ranks of observations from one part of the samples compared with the ranks of the rest observation in the sample. • Binomial test are applied to problems concerned with where the median/quantile or just proportion. Php:2.1,2.2,2.3,2.4(drop the critical region question),2.7,2.9,2.10,
Review: STT215-315-- The uniform distribution • Def: a r.v. X following uniform distribution • on the interval [a, b] is • Note: a and b are called parameters, and we denoted it by X~unif(a,b). • Eg: Assume that the length X of the use of a conference room has a uniform distribution on the interval [0, 4]. (a) What is probability density function?(b) What is probability that any given conference lasts at least 3 hours? Ex4.45: Suppose the shipping contracts follows a Unif(20,000, 25,000). Find probability that the next shipping contract a) is below $22,000. b) is in excess of $24,000. Unif dist in R: dunif(x,a,b); punif(x,a,b); qunif(per,a,b); runif(N,a,b).
Ch2: Fundamentals of nonparametric methods, order statistics and ranks • Q: How do we describe the distribution where our observations could come from? • Consider a sample of n observations x1,x2,…xn from a continuous distribution, for which we can order from smallest to largest. • Def: We denote the smallest one by x(1) and the largest one by x(n). It follows that x(1)< x(2)<…. <x(n), and we call them ordered statistics. • Def: The empirical distribution function(EDF or edf) is defined as • Thm: With ordered statistics, the empirical distribution function (EDF) can be expressed as:
Ch2: Fundamentals of nonparametric methods, order statistics and ranks • Thm: With ordered statistics, the empirical distribution function(edf) can be expressed as: Eg8: with the following observations: 1,2,50,88,90. 1. Find the empirical distribution function 2. Draw a picture of it 3. If you were told the observations are a simple random sample from a uniform distribution, what would you estimate the two parameters of the uniform distribution? In R: > runif(5, 0,100) [1] 24.99468 31.53659 69.69319 50.38145 99.04450
Ch2: Fundamentals of nonparametric methods, order statistics and ranks Eg8: with the following observations: 1,2,50,88,90. 4. Do you think this distribution could come from uniform distribution? In R: y=runif(5, 0,100) plot.ecdf(y) In R: x=c(1,2,50,88,90); plot.ecdf(x)
Ch2: Fundamentals of nonparametric methods, order statistics and ranks Eg8: with the following observations: 1,2,50,88,90. 4. Do you think this distribution could come from uniform distribution? In R: y=runif(100, 0,100) plot.ecdf(y) In R: x=c(1,2,50,88,90); plot.ecdf(x)
Ch2: Fundamentals of nonparametric methods, Exploring data Exploring data analysis (EDA), a first step in selecting an appropriate technique to analysis the data 1. Descriptive statistics (eg: mean, SD, 5-# summary, range, IQR …) 2. Boxplot (eg: symmetric? skewed?) 3. Histograms and frequency curves (Overall pattern, eg: symmetric/skewed? Peak? Gap?) 4. Empirical and theoretical cumulative distribution graphs (eg: QQ-plot, …)
Ch2: Fundamentals of nonparametric methods, Exploring data mcalpha<-c(0,0,1,2,3,9,14,22,23,29,33,41,41,42,44,52,56,57,58,58,60,62,63,64,65,69,72,73,74,74,75,75,75,77,77,78,78,79,79,80,81,81,81,81,82,82,83,84,84,85,86,87,87,88,90,92,93,95) mcbeta<-c(0,19,22,30,31,37,55,56,66,66,67,67,68,71,73,75,75,78,79,82,83,83,88,96) mcgamma<-c(13,13,22,26,33,33,59,72,72,72,77,78,78,80,81, 82, 85, 85,85 ,86, 88) mcdelta<-c(1, 11 ,13 ,13, 16 ,34, 65, 68, 74, 77, 83, 83, 87) cbind(summary(mcalpha),summary(mcbeta),summary(mcgamma),summary(mcdelta)) boxplot(mcalpha,mcbeta,mcgamma,mcdelta, col=2:5) hist(mcalpha); plot.ecdf(mcalpha)
Ch2: Exploring data Is mcalpha datafrom uniform? Command in R: hist(mcalpha) plot.ecdf(mcalpha) Php: 2.11
Ch2: Fundamentals of nonparametric methods, Exploring data Is mcalpha datafrom uniform? Command in R: plot.ecdf(mcalpha) a=min(mcalpha); b=max(mcalpha) qqplot(mcalpha, runif(length(mcalpha), a,b)) abline(0, 1, col=2) Php: 2.11
Ch2: Fundamentals of nonparametric methods, Exploring data Is mcalpha datafrom Normal? qqnorm(mcalpha) qqline(mcalpha, col = 2)